
Page 145 - 20dynamics of cancer
P. 145
130 250 (a) (b) CHAPTER 7
Probability density 200 0.8
0.6
150
0.4
100
50
1.0 Fraction affected
0
10 –4 10 –3 10 –2 0 0.005 0.01 0.015 0.02 0.2
u u
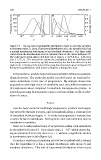
Figure 7.7 The log-normal probability distribution used to describe variation
in transition rates, u. (a) In a log-normal distribution of u, the variable ln(u) has
a normal distribution with mean m and standard deviation s. The three solid
curves show the distributions used to calculate three of the curves in Figure 7.8.
The solid curves from right to left have (m, s) values: (−4.77, 0.2), (−5.25, 0.6),
and (−5.75, 1). The dotted line shows the probability that an individual will
have progressed to cancer by age 80, measured by the fraction affected on the
right scale. I calculated the dotted line using the parameters given in Figure 7.8.
(b) Same as panel (a) but with linear scaling for u along the x axis.
In this section, I analyze how continuous variation influences epidemi-
ological pattern. The particular model I study focuses on variation be-
tween individuals in the rate of progression. My analysis shows that
populations with high levels of variability have very different patterns
of progression when compared to relatively homogeneous groups. In
general, increasing heterogeneity causes a strong decline in the acceler-
ation of cancer.
PR ´ ECIS
I use the basic model of multistage progression, in which carcinogen-
esis proceeds through n stages, and each individual has a constant rate
of transition between stages, u. To study heterogeneity, I assume that
u varies between individuals. Both genetic and environmental factors
contribute to variation.
There are L independent lines of progression within each individual,
7
as described in Section 6.3. I use a large value, L = 10 , which causes log-
log acceleration (LLA) to be close to n − 1, without a significant decline
in acceleration late in life (Figure 6.1).
To analyze variation in transition rates between individuals, I assume
that the logarithm of u has a normal distribution with mean m and
standard deviation s. This sort of log-normal distribution often occurs