Page 141 - 20dynamics of cancer
P. 141

126                                                 CHAPTER 7

                                                  R !                    R !
                                       

                                       
                                      6
                                      

                                      


                                      7PSTI


                                                              %KI

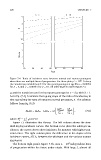
                              Figure 7.4  Ratio of incidence rates between normal and mutant genotypes
                                                                                    8
                              when there are multiple lines of progression. For these plots, L = 10 . To keep
                              the cumulative probability at 0.1 for the normal genotype at age 80, u = 0.00052
                              for n = 5, and u = 0.00753 for n = 10. All other aspects match Figure 7.3.

                              u, and the transition rate for the mutant genotype be v = δu, with δ> 1.
                              As in Eq. (7.4), I calculate the log-log slope of the ratio of incidences, in
                              this case taking the ratio of mutant to normal genotypes, R. The solution
                              follows from Eq. (6.3):
                                                                    v     u
                                                                  δS n−2  S n−2
                                          ΔLLA = LLA u − LLA v = ut  v  −  u    ,       (7.6)
                                                                   S n−1  S n−1
                                     α    j     i
                              where S =   i=0 (αt) /i!
                                     j
                                Figure 7.5 illustrates this theory. The left column shows the stan-
                              dard log-log incidence curves. The bottom curve plots the wild-type in-
                              cidence; the curves above show incidence for mutants with higher tran-
                              sition rates. The right column plots the difference in the slopes of the
                              incidence curves, ΔLLA, between the wild-type and the various mutant
                              genotypes.
                                                                           8
                                The bottom right panel, Figure 7.5h, uses L = 10 independent lines
                              of progression within the tissue under study. With large L, almost all
   136   137   138   139   140   141   142   143   144   145   146