
Page 140 - 20dynamics of cancer
P. 140
THEORY II 125
R ! R !
6
7PSTI
%KI
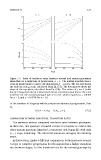
Figure 7.3 Ratio of incidence rates between normal and mutant genotypes
when there is a single line of progression, L = 1. The normal genotype has n
steps in progression to cancer; the mutant has n − j steps. The top row shows
the ratio on a log 10 scale, calculated from Eq. (7.3). The bottom row shows the
slope of the top plots, calculated from Eq. (7.4). The values of j are 1 (solid
lines), 2 (long-dash lines), 3 (short-dash lines), and 4 (dot-dash lines). The total
incidence for the normal genotype was set to 0.1, which required u = 0.0304
for n = 5, and u = 0.0778 for n = 10.
to the number of steps by which a mutation advances progression, that
is,
ΔLLA = LLA n − LLA n−j ≈ j. (7.5)
COMPARISON BETWEEN GENOTYPES: TRANSITION RATES
The previous section compared incidence rates between genotypes.
In that case, one genotype required n steps to progress to cancer; the
other mutant genotype inherited j mutations and began life with only
n − j steps remaining. The inherited mutations abrogate rate-limiting
steps.
In this section, I make a different comparison. Both genotypes require
n steps to complete progression, but the mutant has a higher transition
rate between stages. Let the transition rate for the normal genotype be