
Page 137 - 20dynamics of cancer
P. 137
122 CHAPTER 7
j = 1, p 1 = 0.01 j = 4, p 4 = 0.01 j = 4, p 4 = 0.001
-1
-2
Incidence -3
-4
-5
-6
8
Acceleration 6 4
2
1.0
0.8
Frequency 0.6
0.4
0.2
0
20 40 80 20 40 80 20 40 80
Age
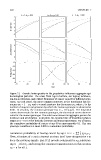
Figure 7.2 Genetic heterogeneity in the population influences aggregate epi-
demiological patterns. The rows, from top to bottom, are log-log incidence,
log-log acceleration, and relative frequency of cancer caused by different geno-
types. In each panel, the most common genotype in the population has fre-
quency p 0 = 1 − p j , and a second genotype has frequency p j , where j is the
number of stages in progression by which the mutant genotype is advanced at
birth. In all plots, the common genotype has n = 10 stages. The long-dash
curves show results for the common genotype, the short-dash curves show re-
sults for the mutant genotype. The solid curve shows the aggregate pattern for
incidence and acceleration. In all plots, the constant rate of transition between
stages is u = 0.0778 for both the common and mutant genotypes. For all cases,
the cumulative probability of cancer at age 80 is approximately 0.1. The rare
genotype contributes at most 0.005 to cumulative probability.
n−1
cumulative probability of having cancer by age t is z = j=0 p j x jn−j .
Here, all values of z and x depend on time, but I have dropped the t to
keep the notation simple. Eqs. (7.2) provide solutions for x ji , substitut-
ing n − j for n j , and noting the constant transition rates in this section,
u j = u for all j.