
Page 135 - 20dynamics of cancer
P. 135
120 CHAPTER 7
2
u j ˙ x jn j −1 = u (x jn j −2 − x jn j −1 ). These expansions give everything in
j
terms of x ji , for which we have explicit solutions from an earlier section
as
i
x ji = e −u j t u j t /i! i = 0,...,n j − 1 (7.2a)
n j −1
x jn j = 1 − x ji . (7.2b)
i=0
CONCLUSIONS
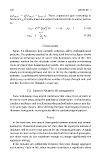
Figure 7.1 illustrates how multiple pathways affect epidemiological
patterns. The pathway marked by the long-dash line in the figure shows
a slowly accelerating cause of cancer that dominates early in life. The
pathway marked by the dot-dash curve shows a rapidly accelerating
cause of cancer that dominates late in life. The aggregate acceleration,
shown by the sold curve in Figure 7.1b, is controlled early in life by the
slowly accelerating pathway and late in life by the rapidly accelerating
pathway. A pathway with intermediate acceleration, shown by the short-
dash curve, contributes a significant number of cases through mid- and
late life, but does not dominate at any age.
7.2 Discrete Genetic Heterogeneity
Some individuals may inherit mutations that cause them at birth to
be one or more steps along the pathway of progression. In this section,
I analyze incidence and acceleration when individuals separate into dis-
crete genotypic classes. After deriving the basic mathematical results, I
illustrate how genetic heterogeneity affects epidemiological pattern.
PR ´ ECIS
In the first case, one cannot distinguish between mutant and normal
genotypes. If mutated genotypes are rare, then the aggregate pattern of
incidence will be close to the pattern for the common genotype. A small
increase in cases early in life does develop from the mutated genotypes,
but those cases do not contribute enough to change significantly the
aggregate pattern.
If the mutants are sufficiently frequent, they may change aggregate
acceleration. Early in life, when mutants contribute a significant share