Page 133 - 20dynamics of cancer
P. 133

118                                                 CHAPTER 7

                                               –2
                                                               (a)
                                               –3
                                              Incidence  –4

                                               –5
                                               –6


                                               10              (b)
                                              Acceleration  8 6


                                                2 4
                                               1.0             (c)
                                               0.8
                                              Frequency  0.6

                                               0.4
                                               0.2
                                                0
                                                  20           40           80
                                                              Age


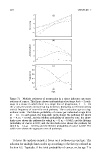
                              Figure 7.1  Multiple pathways of progression in a tissue influence age-onset
                              patterns of cancer. This figure shows epidemiological patterns for k = 3 path-
                              ways in a tissue in which there is a single line of progression, L = 1. On
                              the y axis, the panels measure (a) log incidence, (b) log-log acceleration (LLA),
                              and (c) frequency of cancer for each pathway. The x axis plots age on a log-
                              arithmic scale. The lifetime probability of cancer per individual at age 80 is
                              m = 0.1. In each panel, the long-dash curve shows the pathway for which
                              n 1 = 4, u 1 = 0.0103, and the lifetime probability of cancer is 0.01; the short-
                              dash curve shows the pathway for which n 2 = 8, u 2 = 0.0413, and the lifetime
                              probability of cancer is 0.02; and the dot-dash curve shows the pathway for
                              which n 3 = 13, u 1 = 0.1016, and the lifetime probability of cancer is 0.07. The
                              solid curve shows the aggregate over all pathways.


                                To keep the analysis simple, I focus on k pathways in one line. The
                              solution for multiple lines scales up according to the theory outlined in
                              Section 6.3. Typically, if the total probability of cancer, m, by age T is
   128   129   130   131   132   133   134   135   136   137   138