
Page 128 - 20dynamics of cancer
P. 128
THEORY I 113
multiplied by the clone size, y, so the outflux of that cell lineage from
time s to time t is
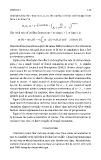
t K i v i K i /r i
D i (t, s) = e − s v i y i (α)dα = .
K i + e i (t−s) − 1
r
The total rate of outflux from stage i to stage i + 1 at time t is
t
u i (t) = v i y (t) = v i u i−1 (s) D i (t, s) y i (t − s) ds/x i (t) .
i
0
This model is general enough to fit many different shapes of acceleration
curves. However, the goal here is not to fit but to emphasize that a few
general processes can explain the differences between tissues in their
acceleration patterns.
Figure 6.9a illustrates the effect of changing the rate of clonal expan-
sion, r, in a single round of clonal expansion in stage n − 1, similar
to the model of Luebeck and Moolgavkar (2002). Slower clonal expan-
sion causes the acceleration in cancer to happen more slowly and to be
spread over more years, because slow clonal expansion causes a slow
increase in the rate at which a lineage acquires the final transition that
leads to cancer. A rapid round of clonal expansion effectively reduces
by one the number of steps, n, so that for n = 4, one round of rapid
clonal expansion yields a nearly constant acceleration of n − 2 = 2 over
all ages (not shown). By contrast, slow clonal expansion often causes a
midlife peak in acceleration, as illustrated in the figure.
Figure 6.9b shows that an increase in maximum clone size raises the
peak level of acceleration until the clone becomes large enough that a
transition almost certainly occurs in a short time interval, after which
further clonal expansion does not increase the rate of progression.
Figure 6.9c shows that multiple rounds of clonal expansion can great-
ly increase the peak acceleration of cancer. The curves from bottom to
top have one, two, or three rounds of clonal expansion.
CONCLUSIONS
Transition rates that increase slowly over time cause acceleration to
rise to a midlife peak and then decline late in life. Clonal expansion may
be one way in which transition rates rise slowly over time. Alternatively,
somatic mutation rates may increase as various checks on the cell cycle
and DNA integrity decay with age.