
Page 124 - 20dynamics of cancer
P. 124
THEORY I 109
E F
%GGIPIVEXMSR
%KI
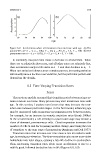
Figure 6.8 Acceleration when all transition rates increase with age. (a) The
parameters are n = 4, u = 0.02, F = 20, a = 8.5, b = 1.5, T = 100. (b) The
parameters are n = 4, u = 0.012, F = 5, a = 5, b = 5, T = 100.
In summary, unequal rates cause a decrease in acceleration. When
there are n s relatively slow rates, and all other rates are relatively fast,
then acceleration early in life starts at n − 1 and then declines to n s − 1.
When rate variation follows a more complex pattern, increasing variation
will usually cause a decline in acceleration, but the particular pattern will
depend on the details.
6.5 Time-Varying Transition Rates
PR ´ ECIS
The previous models assumed that transition rates between stages re-
main constant over time. Many process may alter transitions rates with
age. In this section, I analyze two factors that may increase the tran-
sition rate between particular stages. In the first model, advancing age
may be associated with an increase in transition rates between stages,
for example, by an increase in somatic mutation rates (Frank 2004a).
In the second model, a cell arriving in a particular stage may initiate a
clone of aberrant, precancerous cells. Clonal expansion increases the
number of cells at risk for acquiring another change, increasing the rate
of transition to the next stage of progression (Armitage and Doll 1957).
Transition rates that increase over time cause a rise in incidence with
age, increasing acceleration. The faster transitions also move more older
individuals into later stages, causing a late-life decline in acceleration.
Thus, increasing transition rates often cause acceleration to rise to a
midlife peak, followed by decline late in life (Figures 6.8, 6.9).