
Page 125 - 20dynamics of cancer
P. 125
110 CHAPTER 6
E
F
%GGIPIVEXMSR
G
%KI
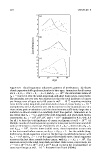
Figure 6.9 Clonal expansion influences patterns of acceleration. (a) Slower
clonal expansion shifts peak acceleration to later ages. Parameters for all curves
6
are n = 4, K i = 1 for i = 0,...,n −2, and K n−1 = 10 . The curves have values of
r n−1 = 0.4, 0.2, 0.1 for the solid, long-dash, and short-dash curves, respectively.
The mutation rate per year was adjusted so that the total incidence of cancer
per lineage over all ages up to 80 years is m/L = 10 −9 , requiring mutation
rates for the solid, long-dash, and short-dash curves of, respectively, v = 10 −5
multiplied by 3.15, 4.35, 8.0 for all i. (b) An increase in the maximum size of a
clone raises peak acceleration until the clone becomes sufficiently large that a
mutation is almost certain in a relatively short time period. Parameters as in
(a), except that r n−1 = 0.2, and for the sold, long-dash, and short-dash curves,
4
2
6
respectively, K n−1 = 10 , 10 , 10 , and v = 10 −5 multiplied by 4.35, 4.45, 6.8
for all i to keep the total incidence of cancer per lineage at m/L = 10 −9 . (c)
Multiple rounds of clonal expansion greatly increase peak acceleration and shift
peak acceleration to a later age. Parameters are n = 4, r = 0.5 for all i, K 0 = 1,
6
and K n−1 = 10 . For the lower (solid) curve, clonal expansion occurs only
in the last round before cancer, so K n−2 = K n−3 = 1. For the middle (long-
dash) curve, clonal expansion occurs in the last two rounds before cancer, with
6
K n−2 = 10 and K n−3 = 1. For the upper (short-dash) curve, clonal expansion
6
occurs in the last three rounds before cancer, with K n−2 = K n−3 = 10 . The
mutation rates for the solid, long-dash, and short-dash curves, respectively, are
v = 5.8 × 10 −4 , 9.3 × 10 −5 , 1.55 × 10 −6 for all i to keep the total incidence of
cancer per lineage at m/L = 10 −5 . Redrawn from Frank (2004b).