
Page 149 - 20dynamics of cancer
P. 149
134 CHAPTER 7
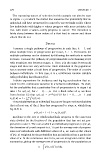
The truncating nature of selection in this example can also be seen
in Figure 7.7, in which the dotted line measures the probability that an
individual will have progressed to cancer by age 80 (right scale). Those
few individuals with higher u values progress with near certainty; the
rest, with lower u values, rarely progress to cancer. The transition is
fairly sharp between those values of u that lead to cancer and those
values that do not.
DETAILS
I assume a single pathway of progression in each line, k = 1, and
allow multiple lines of progression per tissue, L ≥ 1. Extensions for
multiple pathways can be obtained by following the methods in earlier
sections. I assume the pathway of progression has n rate-limiting steps
with transition rate between stages, u. Here, u is the same between all
stages and does not vary with time. Each individual in the population
has a constant value u in all lines of progression. The value of u varies
between individuals. In this case, u is a continuous random variable
with probability distribution f(u).
I obtain expressions for incidence and log-log acceleration that ac-
count for the continuous variation in u between individuals. To start,
let the probability that a particular line of progression is in stage i at
time t be x i (t, u), for i = 0,...,n. For a fixed value of u, we have
i
from Section 6.2 that x i (t, u) = e −ut (ut) /i! for i = 0,...,n − 1 and
n−1
x n (t, u) = 1 − x i (t, u).
i=0
The probability that an individual has cancer by age t is the probability
that at least one of the L lines has progressed to stage n, which from
Eq. (6.5) is
L
p(t, u) = 1 − [1 − x n (t, u)] .
Incidence is the rate at which individuals progress to the cancerous
state divided by the fraction of the population that has not yet pro-
gressed to cancer. The rate at which an individual progresses is ˙ p(t, u),
the derivative of p with respect to t. To get the average rate of progres-
sion over individuals with different values of u, we sum up the values
of ˙ p(t, u) weighted by the probability that an individual has a particular
value of u. In the continuous case for u, we use integration rather than
summation, giving the average rate of progression in the population as
a = ˙ p (t, u) f (u) du.