Page 148 - 20dynamics of cancer
P. 148

THEORY II                                                   133

                                               9  (a)                  97.5–100
                                                                       95.0–97.5
                                               7
                                             Acceleration  5           00.0–90.0
                                                                       92.5–95.0
                                                                       90.0–92.5
                                               3
                                               1
                                              –1
                                               0 (b)
                                             Fraction affected  –2
                                              –1


                                              –3

                                              –4
                                               9
                                             Acceleration  5
                                               7


                                               3

                                               1  (c)
                                                30       40    50    60  70  80
                                                              Age


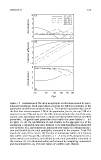
                              Figure 7.9  Explanation of the drop in aggregate acceleration caused by popu-
                              lation heterogeneity. Each panel shows patterns for different segments of the
                              population stratified by transition value, u. The legend in (a) shows that each of
                              the first four strata comprise 2.5% of the population, that is, the top 2.5% of u
                              values, the next 2.5%, and so on. The fifth stratum includes the rest of the pop-
                              ulation, with individuals that have u values that fall between the 0th and 90th
                              percentiles. All panels have parameters that match the curve labeled s = 0.6
                              in Figure 7.8. (a) The contribution of each stratum to the aggregate LLA of the
                              population. I calculated each curve from Eq. (7.8), with denominators integrated
                              over all values of u, and numerators integrated over values of u within each stra-
                              tum and divided by the total probability contained in the stratum. Total LLA
                              equals the sum of the curves. (b) Fraction of individuals within each stratum
                              who suffer cancer by age 80, calculated as 1 − b in Eq. (7.7), integrated over u
                              values within each stratum, and divided by the total probability contained in
                              the stratum. (c) LLA calculated within each stratum by integrating numerators
                              and denominators in Eq. (7.8) over values of u within each stratum.
   143   144   145   146   147   148   149   150   151   152   153