
Page 188 - 20dynamics of cancer
P. 188
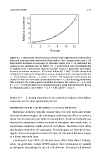
CARCINOGENS  32                                             173


                                          Relative incidence  16


                                            8
                                            4

                                            2
                                            1
                                               1     2      4     8     16    32
                                                             Dosage


                              Figure 9.3 Lower power dose-response curves match higher power curves when
                              dose and response vary over intermediate scales. Here, dosage varies over 1–40
                              and relative incidence in response to exposure varies over 1–50, matching the
                              ranges in the smoking data of Figure 9.1. I scaled both axes logarithmically
                              to analyze how a percentage increase in dose causes a particular percentage
                                                                            r
                              increase in relative incidence. All curves follow k(1 + bd) . In this theoretical
                              example, the solid curve shows the true dose-response if the carcinogen affected
                              r = 6 transitions, with k = 1 and b = 1/43.5. The long-dash curve shows the
                              close fit to the true curve that can be obtained with r = 2 by choosing parameters
                              that minimize the total squared deviations between the curves, k = 0.77 and
                              b = 1/7.7. The short-dash curve shows that only a small improvement in fit can
                              be obtained using a curve with r = 3, k = 0.88, and b = 1/15.9.


                              power of r = 2, noting that there is no statistical evidence that higher
                              exponents fit the data significantly better.

                              DIMINISHING RISE IN CARCINOGENESIS AS DOSAGE INCREASES
                                Multistage analyses typically assume that, for each particular transi-
                              tion rate between stages, the carcinogen either has no effect or causes a
                              linear rise in transition rate with increasing dose. Authors rarely discuss
                              reasons for assuming a linear increase in transition rates with dose. A
                              supporting argument might proceed as follows. Mutation rates often
                              rise linearly with dose of a mutagen. If carcinogens act directly as mu-
                              tagens, then carcinogens increase the rates of transition between stages
                              in a linear way with dose.
                                Carcinogens may often act by processes other than direct mutage-
                              nesis. In particular, Cairns (1998) argued that carcinogens act mainly
                              as mitogens, increasing the rate of cell division. Increased cell division