
Page 185 - 20dynamics of cancer
P. 185
170 CHAPTER 9
1IHMER ]IEVW XS XYQSV
(SWEKI QK OK HE]
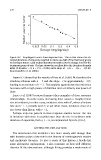
Figure 9.2 Esophageal tumor dose-response line. The circles show the ob-
served durations of exposure required to cause one-half of the treatment group
to develop a tumor. Each median duration is matched to the dosage level for the
treatment group of rats. The line shows the excellent fit to the Druckrey formula
in Eq. (9.4) with r = 3, n = 7, k = 0.036, and a slope of −r/n =−1/s =−1/2.33.
Data from Peto et al. (1991).
Figure 9.2 shows that the results of Peto et al. (1991) fit closely to the
Druckrey relation with n = 7 and the slope −r/n approximately −3/7,
leading to an estimate of r = 3. This analysis again shows that incidence
increases with a high power of duration and a relatively low power of
dose.
Zeise et al. (1987) reviewed many other examples of dose-response
relationships. In some cases, increasing dose causes a roughly linear
r
rise in incidence; in other cases, incidence rises with d , where d is dose
rate and r> 1, usually near 2; in yet other cases, incidence rises at a
rate lower than linear, with r< 1.
Perhaps only one pattern in dose-response studies recurs: the rise
in incidence with dose is usually lower than the rise in incidence with
duration of exposure, that is, r< n, as emphasized by Peto (1977).
ALTERNATIVE EXPLANATIONS
The observation that incidence rises more slowly with dosage than
with duration plays a key role in the history of carcinogenesis studies
and multistage theories. To give a sense of this history, I briefly list
some alternative explanations. I also comment on how well different
theories fit the observations: although fitting provides a weak mode of