
Page 187 - 20dynamics of cancer
P. 187
172 CHAPTER 9
the original fit to the second power of dose provides little evidence with
regard to the number of stages affected.
In general, an expression in a lower power of dosage, d, will often fit
the data about as well as an expression in a higher power of d over a
moderate range of dosage (Zeise et al. 1987; Pierce and Vaeth 2003). In
fitting data, one usually prefers the fit from the lower exponent because
it is regarded as more parsimonious. However, when trying to infer
biological mechanism, moderate distinctions between the goodness-of-
fit of expressions that have various exponents on d do not provide strong
evidence about the number of stages affected by a carcinogen.
In the remainder of this section, I present some examples and tech-
nical issues about dose-response curves for those readers who like to
see the details (see also Pierce and Vaeth 2003). Suppose a carcino-
gen affects all n transitions equally. Then dosage raises incidence by
n
k(1 + bd) , where k is an arbitrary constant, and bd is the incremen-
tal increase in transition rate caused by dose d and scaling factor b.
The expression for dosage can be expanded into a series of terms with
increasing powers of d as
n
n i
n
k(1 + bd) = k (bd) .
i
i=0
As bd declines, those terms with smaller exponents on d increasingly
dominate the contribution of dosage, and so it would appear in the data
as if the exponent on dose was small.
The smoking data in Figure 9.1 provide a good example. In those data,
the exponent on duration suggests that n ≈ 6, that dosage varies over a
range of about 0–40 cigarettes per day, and that incidence increases by
a factor of about 50 over the range of dosage studied. Using those data
to provide reasonable ranges for dosage and for the consequences on
incidence, suppose that a carcinogen affects incidence by the expression
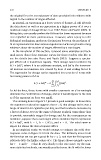
r
k(1 + bd) , with k = 1, b = 1/43.5, and r = 6. The solid curve in
Figure 9.3 shows the dose-response effect.
In an empirical study, we would attempt to estimate the solid dose-
response curve in Figure 9.3 from the data. The difficulty arises from
the fact that we can get a good fit for r = 2, and that the fit improves
relatively little for higher values of r. The figure shows example curves
for r = 2 and r = 3 that fit very closely to the true curve. By the com-
mon statistical methods, one would usually choose the fit with the lower