
Page 192 - 20dynamics of cancer
P. 192
CARCINOGENS 177
100 (a) (b)
Relative risk 75
50
25
0 10 20 30 40 0 10 20 30 40
Dose
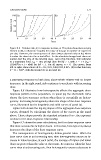
Figure 9.5 Relative risk, S, in response to dose, d. The plots show dose varying
from 0 to 40, to illustrate roughly the range of dosage in number of cigarettes
per day. However, the consequences of dose always depend only on bd, where
b scales the dose into the actual effect. So the absolute dosage level does not
matter, but the size of the interval does. (a) In this function, risk saturates
to a maximum level, S m = 100, at high dose for bd > 1, with S = 1 + (S m −
n
1)(bd) (n + 1 − nbd) for bd < 1. For all curves, n = 6. The curves, from
left to right, show values of b = 0.1, 0.05, 0.04, 0.03, 0.025. (b) In this function,
n
S = (1 + bd) , with all parameters as in panel (a).
a saturating response to high dose, above which relative risk no longer
increases. In the right panel, risk continues to accelerate with increasing
dose.
Figure 9.6 illustrates how heterogeneity affects the aggregate dose-
response pattern in the population. In panel (a), the short-dash curve
shows the dose-response pattern when there is essentially no hetero-
geneity. Increasing heterogeneity alters the shape of the dose-response
curve, illustrated by the long-dash and solid curves of panel (a).
Figure 9.6b shows the log-log slopes of the aggregate dose-response
curves, obtained by calculating the slopes of the curves in the panel
above. These slopes provide the standard estimates for r, the exponent
on dose in the dose-response relationship.
Figure 9.7 shows the same calculations, but for a base response curve
that does not saturate at higher doses. In this case, heterogeneity always
increases the slope of the dose-response curve.
The consequences of heterogeneity follow general rules. When the
base curve rises at an increasing rate, then heterogeneity causes an in-
crease in value because, at each point, the average of higher and lower
doses is greater than the value at that point. By contrast, when the base
curve rises at a decreasing rate, then heterogeneity causes a decrease in