
Page 194 - 20dynamics of cancer
P. 194
CARCINOGENS 179
100 (a) (c)
Relative risk 75
50
25
5 (b) (d)
Log-log slope 3
4
2
1
0 10 20 30 40 0 10 20 30 40
Dose
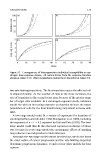
Figure 9.7 Consequences of heterogeneity in individual susceptibility on car-
cinogen dose-response curves. All curves derive from the response function
shown in Figure 9.5b. Other assumptions match those described in Figure 9.6.
two rate-limiting transitions. The first transition causes the affected cell
to expand clonally. As the number of cells in the clone increases, the
rate of transition to the second stage rises because of the greater num-
ber of target cells available. In a carcinogen exposure study, incidence
would rise with an increasing exponent on duration because the target
population of cells for the final transforming step would increase with
time.
A two-stage model could fit a variety of exponents for duration of
smoking (Gaffney and Altshuler 1988; Moolgavkar et al. 1989), including
the exponent of n − 1 ≈ 4.5 reported by Doll and Peto (1978). The two-
stage model could also fit the observed exponent on dosage of about
two, because in a two-stage model the carcinogenic effects of smoking
may influence two independent transformations.
Although the two-stage model cannot be ruled out, we do not know
the exact nature of cancer progression and the rate-limiting steps that
determine progression dynamics. I tend to favor other models for four
reasons.