
Page 197 - 20dynamics of cancer
P. 197
182 1500 (a) (b) CHAPTER 9
Lung cancer deaths per 100,000 1000 500
40 50 60 70 80 40 50 60 70 80
Age
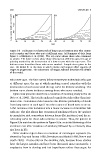
Figure 9.8 Reduction in relative risk of lung cancer between men who contin-
ued to smoke and those who quit at different ages. (a) Summary of data from
Figure 1 of Halpern et al. (1993). The top curve shows those who continued
to smoke. The lower curves show those who quit at different ages, the age of
quitting marked by the intersection of a lower curve with the top curve. The
bottom curve describes those who never smoked. Sample sizes given in the
text. (b) Model fit to the data in which smoke carcinogens affect equally all
stages in progression. The subsection All Stages Affected describes the details
of the model.
who never quit. The four curves below it represent individuals who quit
at different ages; the age at which smoking ceased coincides with the
intersection of each curve with the top curve for lifetime smoking. The
bottom curve shows incidence among those who never smoked.
Figure 9.9a presents data from a cessation of smoking study in the UK
(Peto et al. 2000). That study analyzed cumulative risk rather than inci-
dence rate. Cumulative risk measures the lifetime probability of death
from lung cancer at each age if no other causes of death were to occur.
A flat incidence rate translates into a linear increase in cumulative risk
with age. The plot shows that cessation of smoking reduces the upslope
in cumulative risk, somewhere between linear (flat incidence) and the ac-
celerating curve for those who continue to smoke. Thus, the pattern in
Figure 9.9a matches the pattern in Figure 9.8a: an initial flattening of the
incidence rate after cessation of smoking followed by a relatively slow
rise later in life.
Other studies report data on cessation of carcinogen exposure (re-
viewed by Day and Brown 1980; Freedman and Navidi 1989; Pierce and
Vaeth 2003). I focus only on the smoking data, because those studies
have the largest samples and have been discussed most extensively. I
emphasize how to develop and test hypotheses rather than argue for