
Page 193 - 20dynamics of cancer
P. 193
178 CHAPTER 9
100 (a) (c)
Relative risk 75
50
25
5 (b) (d)
Log-log slope 3
4
2
1
0 10 20 30 40 0 10 20 30 40
Dose
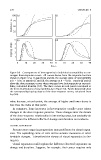
Figure 9.6 Consequences of heterogeneity in individual susceptibility on car-
cinogen dose-response curves. All curves derive from the response function
shown in Figure 9.5a: in panels (a) and (b), the average value of susceptibility
is b = 0.05; in panels (c) and (d), the average is b = 0.025. Panels (a) and (c)
show the dose-response curves when averaged over heterogeneity in suscepti-
bility, calculated from Eq. (9.5). The three curves in each panel correspond to
the three distributions of susceptibility, b, in Figure 9.4. Panels (b) and (d) show
the corresponding log-log slopes of the dose-response curves, calculated from
Eq. (9.6).
value because, at each point, the average of higher and lower doses is
less than the value at that point.
In summary, large increases in heterogeneity usually cause minor
changes in the dose-response patterns. Those changes alter the details
of the dose-response relationship in interesting ways, but probably do
not explain the different effects of dosage and duration on incidence.
CLONAL EXPANSION
Precancerous stages in progression may proliferate by clonal expan-
sion. The expanding clone of cells carries somatic mutations or other
heritable changes. I described the theory of clonal expansion in Sec-
tion 6.5.
Clonal expansion could explain the different observed exponents on
dosage and duration. Suppose, for example, that cancer requires only