
Page 200 - 20dynamics of cancer
P. 200
CARCINOGENS 185
on the other hand, the last stage were affected, one would expect
the rate to drop immediately to the rate for nonsmokers. What
seems to happen is a stabilization at the current rate until it is
caught up by the rate for nonsmokers. That is precisely what one
would expect if the next to last stage in a multi-stage process were
affected.
I should be interested to know whether Professor Doll has con-
sidered this anomaly and can resolve it. Is it, for example, conceiv-
able that two stages in a multi-stage process are affected ...?
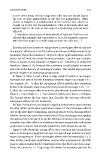
Exactly how does incidence change when a carcinogen affects only one
of n stages? Whittemore (1977) and Day and Brown (1980) presented ap-
proximate theoretical analyses. However, those approximations can be
rather far off from the actual theoretical values. I prefer exact calcula-
tions as shown in the example of Figure 9.10. I describe in detail the
results in Figure 9.10, because this particular model played an impor-
tant role in the history of carcinogen studies. The model also provides
general insight into multistage progression.
In Figure 9.10a,b, I used a basic n stage model in which a carcinogen
increases the rate of the ith transition between stage i and stage i + 1.
For example, if i = 0, then the carcinogen affects only the first transition
between the baseline stage 0 and the first precancerous stage 1; if i = n−
2, then the carcinogen affects only the penultimate transition between
stage n − 2 and stage n − 1. The model in Figure 9.10 has n = 6 stages.
The legend shows the line types that describe the outcome when the
carcinogen affects the ith transition.
In Figure 9.10a,b, the carcinogen is applied only between age 0 and age
60, after which carcinogen application ceases. If the carcinogen affects
one of the first three transitions, shown in Figure 9.10a, then incidence
follows closely the curve that would result if the carcinogen was applied
throughout life, from age 0 to age 80. With acceleration of an early stage,
cessation has little effect on incidence because anyone who ultimately
progresses to cancer has already passed the early stages by age 60.
Figure 9.10b shows the strong effect that cessation has on incidence
when a carcinogen is applied from age 0 to age 60 and influences a later
stage in progression. If the carcinogen affects the last transition, i = 5,
then during carcinogen application, anyone who progresses to the fifth
stage is almost immediately transformed into the final cancerous stage.
Thus, the curve for i = 5 up to age 60 shows the incidence pattern for