
Page 183 - 20dynamics of cancer
P. 183
168 CHAPTER 9
In most empirical studies, incidence rises with a much lower power
of dose than duration, r< n. This fact has led most authors to suggest
that carcinogens typically affect only a subset of the transitions. For
example, if one estimates r = 2 and n = 6, then one could interpret
those results by concluding that the carcinogen affects two of the six
transitions.
Later, I will suggest that this classic formulation of the theory may be
misleading. In particular, the observation that the exponent on dosage
is usually less than the exponent on duration does not necessarily imply
that the carcinogen affects only a small number of transitions. However,
the classic puzzle for the different responses to dosage and duration
arises from the theory outlined here, so I use that theory as my starting
point.
CIGARETTE SMOKING
The classic study of cigarette smoking among British doctors esti-
mated annual lung cancer incidence in the age range 40–79 as I(τ) ≈
2
c(1+d/6) τ 4.5 , where c is a constant, d is dosage measured as cigarettes
per day, and τ = t −t 0 is duration of smoking with t as age and t 0 = 22.5
as estimated age at which smoking starts (Doll and Peto 1978). If we use
the expression for incidence in Eq. (9.1), then the estimate by Doll and
Peto (1978) corresponds to r = 2 and n = 5.5.
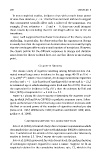
Figure 9.1 shows the dose-response relationship for cigarette smok-
ing, in which Doll and Peto (1978) fit a quadratic response curve. Subse-
quent authors have reiterated that lung cancer incidence increases with
the first or second power of the number of cigarettes smoked per day
(Zeise et al. 1987; Whittemore 1988; Freedman and Navidi 1989; Mool-
gavkar et al. 1989).
CARCINOGEN APPLIED TO LABORATORY RATS
Peto et al. (1991) presented a large dose-response experiment in which
they applied the carcinogen N-nitrosodiethylamine (NDEA) to laboratory
rats. I summarized the details of this experiment and other laboratory
studies in Section 2.5. Here, I repeat the main conclusions.
Peto et al. (1991) measured, for each dosage level, the median duration
of carcinogen exposure required to cause a tumor. Suppose we fit an
empirical relation for the cumulative incidence rate, CI, which is the