Page 184 - 20dynamics of cancer
P. 184

CARCINOGENS                                                 169


                                                 500

                                             Incidence per 10 5  400  300


                                                 100  200


                                                 0
                                                 0      10     20     30     40
                                                    Dose (cigarettes/day)


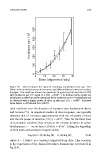
                              Figure 9.1  Dose-response for cigarette smoking, standardized for age. The
                              filled circle and error bars mark the mean and 90% confidence interval at various
                              dosages. The solid line shows the quadratic fit given by Doll and Peto (1978)
                                                                   2
                                                5
                              with incidence per 10 equal to 9.36(1 + d/6) . The dashed curve shows my
                                                                               5
                              calculation in which a nearly equivalent fit for incidence per 10 individuals can
                                                                                   5
                              be obtained with a higher power of dose, in this case 25(1 + d/46) . Redrawn
                              from Figure 1 of Doll and Peto (1978).
                              total incidence over the duration of exposure (see Background above
                              and Section 7.5). In empirical studies of dose-response, one typically
                              observes that CI increases approximately with the rth power of dose
                                                                    r n
                              and the nth power of duration, CI(τ) ≈ cd t . Then for the fixed level
                              of cumulative incidence that occurs at the median duration to tumor
                                                                     r
                                                                       n
                              development, τ = m, we have CI(m)/c ≈ d m . Taking the logarithm
                              of both sides and solving for log(m) yields
                                            log (m) ≈ (1/n) log (k) − (r/n) log (d) ,   (9.4)

                              where k = CI(m)/c is a constant estimated from data. This equation
                              is the expression of the classical Druckrey formula that I presented in
                              Eq. (2.4).
   179   180   181   182   183   184   185   186   187   188   189