
Page 321 - 16Neonatal Jaundice_compressed
P. 321
Appendix H: Evidence tables
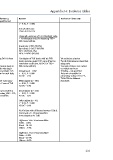
Bibliographic details Study type & Patient characteristics Test, Reference Standard, Results Reviewers Comments
Evidence level Threshold for a positive test
Ethnicity r = 0.78, P < 0.001
Chinese (100%)
For all other sites
Exclusion: not defined r from 0.47 to 0.76
Prevalence of TSB > Diagnostic accuracy of TcB (threshold value
222 micromol/litre = 19.6% (35/178 – > 16 relectance units) for detecting TSB >
site forehead) 222 micromol/litre
Sensitivity: 19/21 (90.5%)
Specificity: 141/157 (89.8%)
PPV: 19/35 (54.3%)
NPV: 141/143 (98.6%)
Maisels MJ; Study Type: Convenience sample of newborn babies TcB using Minolta JM-103 from Correlation of TcB levels with lab TSB No exclusion criterion
Diagnostic study ≥ 35 weeks in the well-baby nursery of 3 the mid-sternum levels and area under ROC curve (Pearson Test & Reference test described
Year: 2004 hospitals. correlation coefficient, AROC for TSB > adequately
Evidence Level: Triplicate measurements made in 222 micromol/litre) Test and reference test carried
Country: II n = 849 two hospitals while only single out within one hour
USA Mean BW: Not reported made in the third, but single TcB All infants (n = 849) Blinding – not specified
Mean GA: Not reported measurement taken for each baby r = 0.91, P < 0.001 Data not extractable for
71 Gender: Not reported for data analysis. AROC = 0.96 calculating values of TP, FP,
TN & FN for different
Ethnicity Reference standard: Laboratory White infants (n = 503) thresholds
white = 59.2% TSB levels within 1 hour of TcB r = 0.95, P < 0.001
black = 29.8% measurement AROC = 0.96
other = 10.9%
Area under ROC curve (AROC) Black infants (n = 253)
Prevalence of TSB > calculated for detecting TSB > 170, r = 0.82, P < 0.001
257 micromol/litre = 3.3% (28/849) 222 and 255 micromol/litre AROC = 0.97
Exclusion: babies who had received Other infants (n = 93)
phototherapy r = 0.92, P < 0.001
AROC = 0.96
% of infants with difference between TSB &
TcB levels of > 34 micromol/litre
(overestimation by TcB)
Difference 34 to 50 micromol/litre
White – 4.0%
Black – 24.1%
Others – 5.4%
Difference 51 to 67 micromol/litre
White – 2.0%
Black – 10.7%
Others – 2.2%
233