
Page 166 - 15Diarrhoeaandvomiting
P. 166
Appendix A
clinical question for this guideline sought to compare the cost-effectiveness of ORT, more broadly
defined, versus standard IVT. Owing to the lack of relevant published economic evidence, it was
decided that a decision-analytic model should be developed for this guideline to compare the
cost-effectiveness of ORT versus standard IVT in order to inform GDG recommendations.
Method
A decision-analytic model has been developed in Microsoft Excel® in order to compare the
cost-effectiveness of IVT and ORT in the treatment of children presenting with dehydration and
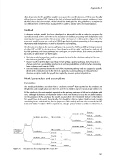
vomiting due to gastroenteritis. The structure of the decision tree is illustrated in Figure A.1. The
economic model focuses on a cohort of 1000 hypothetical patients presenting in the emergency
department with dehydration caused by diarrhoea and vomiting.
The decision tree depicts the various pathways it is assumed a child may follow during treatment
of either IVT or ORT. In decision trees, ‘time flows from left to right’ and branches indicate all
feasible pathways and these pathways are contingent on certain events. Such events are defined
by nodes, of which there are three types:
• Decision nodes (squares) are used to represent choices for the decision maker, in this case
the choice to give IVT or ORT.
• Chance nodes (circles) depict uncertain events within a patient pathway. Each branch at a
chance node has a probability attached to it and the probabilities of all branches emanating
from a chance node sum to 100%.
• Terminal nodes (arrows) denote the end of the treatment pathway and are assigned a ‘payoff’,
which is the estimated cost to the NHS of a particular patient pathway. In this particular
decision-analytic model, the payoff also implicitly assumes patient rehydration.
Model parameters and assumptions
Probabilities
83
The model probabilities are taken from a Cochrane review that reported on the evidence on
rehydration and complication rates for ORT and IVT in children up to 18 years of age (Table A.1).
All the studies in the meta-analysis reported on the primary outcome of failure to rehydrate with
ORT, although definitions of treatment ‘failure’ were not identical across the included studies.
For the purposes of this analysis, the model assumes that ORT treatment ‘failure’ is that where
IVT would have to be used. Theoretically, IVT should be able to replace fluid lost and manage
continuing losses and therefore, for the purposes of this model, we have also assumed that IVT
treatment ‘failure’ is where IVT is required for a longer period of time and this is referred to as
Figure A.1 Decision tree for comparing ORT versus IVT
141