
Page 546 - untitled
P. 546
Peter J. Wallison 517
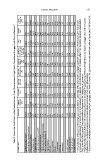
Jumbo Conforming Loans (1) $ 19.9 0.7% $579,528 0.12% 1.4% 68.4% 0.0% 69.9% 0.4% 762 0.6% 0.2% 95.2% 98.2% 11.5% 11.3% 0.0% 0.2% 1.1% 0.4%
Table 12. Fannie Mae Credit Profile by Key Product Features: Credit Characteristics of Single-Family Conventional Mortgage Credit Book of Business 136
Subprime Loans (1)
$ 8.4 0.3% $150,445 14.29% 80.7% 77.2% 6.8% 87.3% 24.5% 623 47.6% 27.8% 73.1% 96.6% 4.7% 63.4% 1.0% 2.1% 2.0% 2.0%
Alt-A Loans (1)
$ 292.4 10.1% $170,250 7.03% 72.7% 72.6% 5.3% 81.0% 23.2% 719 0.7% 8.7% 72.3% 77.8% 10.8% 38.6% 29.2% 47.6% 43.2% 45.6%
Loans with FICO < 620 and Original LTV Ratio > 90% $ 27.3 1.0% $119,607 15.97% 69.8% 98.1% 100.0% 97.7% 38.5% 592 100.0% 0.0% 96.5% 99.4% 5.9% 94.1% 6.4% 5.4% 5.2% 5.4%
Loans with Original LTV Ratio >90% $ 278.3 10.2% $141,569 6.33% 58.8% 97.3% 100.0% 97.6% 38.2% 694 9.8% 19.4% 94.2% 97.1% 9.8% 92.5% 17.4% 21.5% 23.1% 21.3%
Loans with FICO ≥ 620 and < 660 $ 256.1 9.4% $141,746 5.64% 55.0% 77.5% 21.1% 77.5% 17.6% 641 0.0% 100.0% 92.3% 94.4% 6.6% 36.3% 21.9% 16.8% 17.2% 17.4%
Loans with FICO <620 $ 123.0 4.5% $126,604 9.03% 56.3% 76.7% 22.2% 76.3% 15.9% 588 100.0% 0.0% 93.6% 96.8% 4.9% 35.0% 18.8% 11.3% 11.5% 11.8% (1) Alt-A, Subprime, and Jumbo Conforming Loans are calculated as a percentage of the single-family mortgage credit book of business, which includes gove
Interest-Only Loans $212.9 7.8% $241,943 8.42% 80.9% 75.4% 9.1% 93.4% 35.6% 725 1.3% 7.7% 39.6% 84.9% 16.2% 35.0% 15.0% 36.2% 33.1% 34.2%
Negative- Amortizing Loans $17.3 0.6% $142,502 5.61% 62.0% 71.1% 0.3% 87.2% 42.8% 698 10.7% 10.1% 0.1% 70.4% 13.5% 76.3% 0.9% 3.8% 2.2% 2.9%
Overall Book $2,730.9 $148,824 100.0 % (FHA) or the Rural Housing and Community Facilities Program and the Department of Agriculture. Includes primary mortgage insurance, pool insurance, lender recourse and other credit enhancement.
100.0% 2.42% 46.5% 71.8% 10.2% 70.0% 11.6% 724 4.5% 9.4% 90.0% 89.7% 9.4% 20.9% 100.0% 100.0% 100.0%
As of Dec 31, 2008 Unpaid Principal Balance (billions)* Share of Single-Family Conventional Credit Book (1) Average Unpaid Principal Balance Serious Delinquency Rate Origination Years 2005-2007 Weighted Average Original Loan-to-value Ratio Original Loan-to-Value Ratio >90 Weighted Average Mark-to Market Loan-to-Va