
Page 489 - untitled
P. 489
460 Dissenting Statement
23
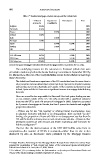
Table 2. Troubled Mortgages, Western Europe and the United States
≥ 3 Month Impaired or Foreclosures Year
Arrears % Doubtful %
Belgium 0.46% 2009
Denmark 0.53% 2009
France 0.93% 2008
Ireland 3.32% 2009
Italy 3.00% 2008
Portugal 1.17% 2009
Spain 3.04% 0.24% 2009
Sweden 1.00% 2009
UK 2.44% 0.19% 2009
U.S. All Loans 9.47% 4.58% 2009
U.S. Prime 6.73% 3.31% 2009
U.S. Subprime 25.26% 15.58% 2009
Source: European Mortgage Federation (2010) and Mortgage Bankers Association for U.S. Data.
Th e underlying reasons for the outcomes in Professor Jaff ee’s data were
provided in testimony before the Senate Banking Committee in September 2010 by
Dr. Michael Lea, Director of the Corky McMillin Center for Real Estate at San Diego
State University:
Th e default and foreclosure experience of the U.S. market has been far worse than in
other countries. Serious default rates remain less than 3 percent in all other countries
and less than 1 percent in Australia and Canada. Of the countries in this survey only
Ireland, Spain and the UK have seen a signifi cant increase in mortgage default during
the crisis.
Th ere are several factors responsible for this result. First sub-prime lending was rare
or non-existent outside of the U.S. Th e only country with a signifi cant subprime
share was the UK (a peak of 8 percent of mortgages in 2006). Subprime accounted
for 5 percent of mortgages in Canada, less than 2 percent in Australia and negligible
proportions elsewhere.
…[T]here was far less “risk layering” or off ering limited documentation loans
to subprime borrowers with little or no downpayment. Th ere was little “no doc”
lending…the proportion of loans with little or no downpayment was less than the
U.S. and the decline in house prices in most countries was also less…[L]oans in other
developed countries are with recourse and lenders routinely go aft er borrowers for
defi ciency judgments. 24
Th e fact that the destructiveness of the 1997-2007 bubble came from its
composition—the number of NTMs it contained—rather than its size is also
illustrated by data on foreclosure starts published by the Mortgage Bankers
23 Dwight M. Jaff ee, “Reforming the U.S. Mortgage Market Th rough Private Market Incentives,” Paper
prepared for presentation at “Past, Present and Future of the Government Sponsored Enterprises,”
Federal Reserve Bank of St. Louis, Nov 17, 2010, Table 4.
24 Dr. Michael J. Lea, testimony before the Subcommittee on Security and International Trade and
Finance of the Senate Banking Committee, September 29, 2010, p.6.