
Page 491 - untitled
P. 491
462 Dissenting Statement
28
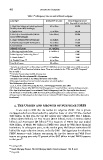
Table 3. Delinquency rates on nontraditional mortgages
Loan Type Estimated # of Loans Total Delinquency Rate
(30+ Days and in Foreclosure)
1. High Rate Subprime (including Fannie/ 6.7 million 45.0%
Freddie private MBS holdings)
2. Option Arm 1.1 million 30.5%
3. Alt-A (inc. Fannie/Freddie/FHLBs 2.4 million† 23.0%
private MBS holdings)
4. Fannie Subprime/Atl-A/Nonprime 6.6 million 17.3%
5. Freddie Subprime/Alt-A/Nonprime 4.1 million 13.8%
6. Government 4.8 million 13.5%
Subtotal # of Loans 25.7 million
7. Non-Agency Jumbo Prime 9.4 million ‡ 6.8%
8. Non-Agency Conforming Prime * 5.6%
9. Fannie Prime ** 11.2 million 2.6%
10. Freddie Prime *** 8.7 million 2.0%
Total # of Loans 55 million
* Includes an estimated 1 million subprime (FICO<660) that were (i) not high rate and (ii) non-prime
CRA and HUD Best Practices Initiative loans. Th ese are included in the “CRA and HUD Programs”
line in Table 1.
** Excludes Fannie subprime/Alt-A/nonprime.
*** Excludes Freddie subprime/Alt-A/nonprime.
† Excludes loans owned or securitized by Fannie and Freddie.
‡ Non-agency jumbo prime and conforming prime counted together.
Total delinquency data sources:
1, 2, 3, 6, 7 & 8: Lender Processing Services, LPS Mortgage Monitor, June 2009.
4 & 9: Based on Fannie Mae 2009 2Q Credit Supplement. Converted from a serious delinquency rate
(90+ days & in foreclosure) to an estimated Total Delinquency Rate (30+ days and in foreclosure).
5 & 10: Based on Freddie Mac 2009 2Q Financial Results Supplement. Converted from a serious
delinquency rate (90+ days & in foreclosure) to an estimated Total Delinquency Rate (30+ days and in
foreclosure).
4. The Origin and Growth of Subprime PMBS
It was only in 2002 that the market for subprime PMBS—that is private
mortgage-backed securities backed by subprime loans or other NTMs—reached
$100 billion. In that year, the top fi ve issuers were GMAC-RFC ($11.5 billion),
Lehman ($10.6 billion), CS First Boston ($10.5 billion), Bank of America ($10.4
29
billion) and Ameriquest ($9 billion). Th e issuances of PMBS that year totaled
$134 billion, of which $43 billion in PMBS were issued by Wall Street fi nancial
institutions. In subsequent years, as the market grew, Wall Street institutions fell
behind the major subprime issuers, so that by 2005—the biggest year for subprime
PMBS issuance—only Lehman was among the top fi ve issuers and Wall Street
issuers as a group were only 27 percent of the $507 billion in total PMBS issuance
in that year. 30
28 Id., Figure 53.
29 Inside Mortgage Finance, Th e 2009 Mortgage Market Statistical Annual—Vol. II, p143.
30 Id., p.140.