
Page 174 - 20dynamics of cancer
P. 174
GENETICS OF PROGRESSION 159
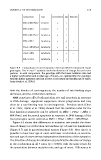
Comparison Type Acceleration Age Mutation
Mlh3 v Mlh3Pms2 GI cancer + + –
Mlh3 v Mlh1 GI cancer + + –
Mlh3 v Mlh3Pms2 Lymphoma + + –
Mlh3 v Mlh1 Lymphoma + + –
Pms2 v Mlh3Pms2 Lymphoma + + –
Pms2 v Mlh1 Lymphoma + + –
Mlh3 v Pms2 Lymphoma + + –
Figure 8.9 Comparison of cancer dynamics for four different mismatch repair
genotypes. The ‘+’ and ‘–’ symbols show the direction of change for each com-
parison. In each comparison, the genotype with the lower mutation rate had
a higher acceleration and median age of onset—or, equivalently, the genotype
with the higher mutation rate had a lower acceleration and median age of onset.
From Frank et al. (2005).
limit the kinetics of carcinogenesis, the number of rate-limiting steps
decreases, and the acceleration declines.
MMR genotypes affect both mutation rate and apoptosis in response
to DNA damage. Apoptosis suppresses cancer progression and may
often be a rate-limiting step in carcinogenesis. Previous work (Chen
et al. 2005; Lipkin et al. 2000) showed that the mutation rates for the
four knockout genotypes can be ordered as Mlh3 < Pms2 < Mlh1 ≈
Mlh3Pms2, and decreased apoptosis in response to DNA damage of the
four genotypes can be ordered as Mlh3 ≈ Pms2 < Mlh1 ≈ Mlh3Pms2.
Figure 8.9 shows that differences in mutation rate predict the direc-
tion of change in acceleration and median age of onset in lymphomas
(Figure 8.7) and in gastrointestinal tumors (Figure 8.8). Note that it is
possible to have later age of onset and lower acceleration, so accelera-
tion and age of onset are two independent dimensions of the dynamics.
The direction of change in mutation rate predicts the direction of change
in the acceleration in all 7 cases (p ≈ 0.008), with the same result for
the association between mutation rate and age of onset. Differences in