
Page 177 - 20dynamics of cancer
P. 177
162 CHAPTER 8
-RGMHIRGI
z
z
"
'SRXVSP
%KI
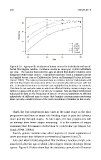
Figure 8.10 Age-specific incidence of breast cancer for individuals with an af-
fected first-degree relative. Incidence shown as cases per 10,000 individuals
per year. The various lines plot the ages at which first-degree relatives were
diagnosed with breast cancer. I calculated incidence from a summary report
on familial breast cancer (Collaborative Group on Hormonal Factors in Breast
Cancer 2001). The report presented data on relative risk for individuals with
affected first-degree kin and on incidence in controls who did not have affected
kin. I calculated incidence as relative risk multiplied by incidence in controls.
The data do not exclude cases in which an affected family carries a major mu-
tation to a gene such as BRCA1 or BRCA2. However, Peto and Mack (2000) used
independent data on the frequency of BRCA1 or BRCA2 mutations in affected
individuals of different ages to argue that families carrying major mutations
make up only a small fraction of the total population of families in this study.
Third, the fast progressors may start in the same stage as the slow
progressors and have as many rate-limiting steps to pass but advance
more quickly through stages. At later ages, the fast progressors will
on average have fewer stages remaining. It is the number of stages
remaining that determines acceleration at a particular age (Figure 6.2;
Frank 2004b, 2004d).
Fourth, genetic variants may affect aspects of clonal expansion or
other processes that influence acceleration (Chapters 6 and 7).
Peto and Mack (2000) suggested that incidence reaches a high, con-
stant level after the age at which a first-degree relative develops breast
cancer. Figure 8.10 does show that the incidence curves level off sooner