Page 171 - 20dynamics of cancer
P. 171

156                                                 CHAPTER 8

                                  1.0  0.8                (a)     1                       (c)
                                Fraction surviving  0.6  0.4    Incidence  0.1  Mlh3


                                                                         Mlh1
                                                                  0.01
                                  0.2
                                                                        Pms2
                                                                     Mlh3Pms2
                                       5     10    15    20         2      4      8     16
                                  1.0  0.8                (b)     5  4                    (d)
                                Fraction surviving  0.6  0.4    Acceleration  3  2


                                  0.2
                                                                  0  1
                                       5     10    15    20         2      4      8     16
                                          Age in months                  Age in months


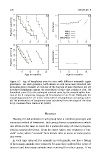
                              Figure 8.7  Age of lymphoma onset in mice with different mismatch repair
                              genotypes. For each genotype, both alleles at each locus were knocked out.
                              (a) Kaplan-Meier estimate at each age of the fraction of mice that have not yet
                              developed lymphoma among the population of mice that remain at risk. (b)
                              Smoothed curve fit to the estimated survival curve by the smooth.spline func-
                              tion of the R computing language (R Development Core Team 2004) with the
                              smoothing parameter set to 0.5. (c) Incidence of lymphomas on log-log scales.
                              (d) The acceleration of lymphoma onset calculated from the slope of the lines
                              in (c). Redrawn from Frank et al. (2005).


                                                         METHODS
                                Usually, the lab animals in each group have a common genotype and
                              common method of treatment. Each group forms a population in which
                              one observes the time to onset for a particular stage of cancer progres-
                              sion in a particular tissue. From the onset times, one estimates a “sur-
                              vival” curve, where “survival” here means time to onset of some partic-
                              ular event.
                                In each time interval, for example in each month, one has a listing
                              of how many animals were removed because they suffered the event of
                              interest and how many animals were removed for other causes. If we
   166   167   168   169   170   171   172   173   174   175   176