Page 504 - An Evidence Review of Active Surveillance in Men With Localized Prostate Cancer
P. 504

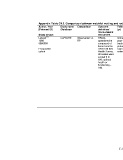
Appendix Table C4.2. Comparison between watchful waiting and radical prostatectomy (continued)
                                        Author, Year         Study name       Comparison           Outcome            Followup      Sample size      Results                          Factors included in the
                                        [Pubmed ID]          /Database                             definition/        (yr)          per group                                         model
                                                                                                   measurement
                                        Study design                                               instrument
                                        Lubeck 227           CaPSURE          Observation vs.      HRQoL              Immediate     Observation:     Estimates are means (SE)         Treatment group
                                        1999                                  RP                   questionnaire      post-         87               based on linear mixed            interaction with time,
                                        9886609                                                    composed of        treatment     RP: 351          model for Observation vs.        age, time of treatment.
                                                                                                   items from the     period                         RP:
                                        Prospective                                                RAND-36 item       regression                     Physical functioning, 74.9       P values for
                                        cohort                                                     Health Survey.     estimates                      (2.6); 73.5 (1.3)                comparisons between
                                                                                                   All scales were                                   Role-physical, 61.7 (4.5);       treatment groups NR.
                                                                                                   scored 0 to                                       34.3 (2.3)
                                                                                                   100; optimal                                      Role-emotional, 72.6 (3.9);
                                                                                                   health or                                         68.6 (2.0)
                                                                                                   functioning =                                     Emotional well-being, 76.4
                                                                                                   100.                                              (1.7); 79.3 (0.9)
                                                                                                                                                     Bodily pain, 73.4 (2.4); 73.0
                                                                                                                                                     (1.3)
                                                                                                                                                     Social functioning, 80.9
                                                                                                                                                     (2.5); 67.2 (1.3)
                                                                                                                                                     Energy/fatigue, 61.5 (2.2);
                                                                                                                                                     58.4 (1.1)
                                                                                                                                                     General health perception,
                                                                                                                                                     60.4 (2.3); 76.0 (1.2)
                                                                                                                                                     Health change, 38.1 (2.7);
                                                                                                                                                     42.5 (1.4)
                                                                                                                                                     Health distress, 77.3 (2.1);
                                                                                                                                                     76.3 (1.1)
                                                                                                                                                     Self-esteem, 82.1 (1.9); 82.4
                                                                                                                                                     (1.0)


                                                                                                                        C-170
   499   500   501   502   503   504   505   506   507   508   509