Page 103 - Screening for Cervical Cancer: Systematic Evidence Review
P. 103

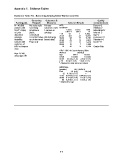
Appendix C.  Evidence Tables


               Evidence Table 1A.  Screening Among Older Women (cont’d)

                                 Screening    Outcomes &                                          Quality
                 Participants    Program        Measures             Relevant Results         Considerations
               N = 40,536     No systematic  Primary        AGE:                              Denom=2
               women with     screening      outcome = CIN   Incidence                        Attrition=2
               58,271 Paps;   program in     1-cancer on                  Cases       Cases           Total   Indications=2
               no prior       place;         cytology                   CIN 1-2        CIN 3                N   Interval=2
               abnormal       centralized                   ≤ 19           43                1           4,962   Age=2
               cytology       recall for follow- (No histology   20-29         203              21         18,531   Relevance=1
                                                            30-39           96              27         13,761
               including      up of abnormal  based data)   40-49           43              13           9,955   Standard=0
               smears with    Paps only                     50-59           22              12           5,370  Score=11
               evidence of                                  60-69           10                7           3,568
               HPV or Herpes                                     70           10                9           2,124   Grade=Fair
               virus
                                                            ORs*  CIN 3 & Cancer Among Older
               Age 13-100,                                  Women                       (95%CI)
               mean age: 36                                 Age                    CIN 3             Cancer
                                                            50-59              1.0 (ref)             1.0 (ref)
                                                            60-69      0.6 (0.2, 1.4)      2.5 (0.7, 9.7)
                                                            ≥ 70      0.8 (0.2, 0.8)      1.9 (0.4, 8.1)
                                                            * Adjusted for time since last smear

                                                            INTERVAL:
                                                            (months)               OR^ (95%CI)
                                                            First               1.0  (ref)              1.0 (ref)
                                                                  12     0.1 (0.0, 0.7)               ---
                                                            13-35    0.04 (0.0, 0.2)    0.04 (0.0, 0.3)
                                                            36-59    0.12 (0.0, 0.4)      0.1 (0.1, 0.8)
                                                                 60    0.26 (0.1, 0.7)      0.5 (0.2, 1.6)
                                                            ^ Adjusted for age


                                                             C-9
   98   99   100   101   102   103   104   105   106   107   108