
Page 236 - 20dynamics of cancer
P. 236
INHERITANCE 221
ple of 50 healthy individuals: heterozygote T/G at 40% and homozygote
G/G at 12%.
A variant affects cancer to the extent that it shifts the age-onset curve
to earlier ages. To measure the variant’s effect, Bond et al. (2004) studied
a group that suffered soft tissue sarcoma (STS) and had no known p53
or other predisposing inherited mutations.
The data collected by Bond et al. (2004) show that the variant allele
shifts age of onset to earlier ages, supporting the hypothesis that the
variant’s increased expression of MDM2 enhances tumor progression.
However, Bond et al.’s (2004) particular quantitative analyses misuse
the data and the theory of multistage progression. I demonstrate proper
analysis, because this study provides just the sort of combined genetic,
functional, and population level insight that will be required to move
the field ahead.
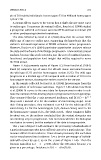
Figure 11.4a,b presents copies of Figure 7C,E from Bond et al. (2004).
Panel (a) compares age of onset for all soft tissue sarcomas between
the wild type (T/T) and the homozygote variant (G/G). The wild type
progresses at a median age of 59 compared with a median of 38 for the
homozygote variant, showing the earlier onset for the variant.
In the sample collected by Bond et al. (2004), liposarcomas form the
largest subset of soft tissue sarcomas. Figure 11.4b shows how Bond
et al. (2004) fit curves to the onset data for liposarcoma in order to esti-
mate the number of rate-limiting steps in progression for each genotype.
They assumed that the y axis measured incidence, and fit I(t) = kt n−1
(they used r instead of n for the number of rate-limiting steps). From
their fitting procedure, they estimated n as 4.8 for the wild type (T/T,
solid curve), 3.5 for the heterozygote (T/G, dashed curve), and 2.5 for
the homozygote variant (G/G, dot-dash curve). These estimates differ
by about one, so the authors concluded that the variant abrogates one
rate-limiting step in progression. I do not know whether the biological
conclusion is correct, but the analysis of the data is inappropriate.
The y axis of Figure 11.4b measures the percentage of individuals of
a particular genotype who have suffered cancer by a particular age. That
measure differs from incidence. I have shown previously that such data
can be transformed into incidence. Let y be the percentage of individ-
uals with cancer by age t, asonthe y axis of Figure 11.4b. Then the
fraction tumorless is S = 1 − y/100, where the 100 arises because y is
given as a percentage. Incidence is I(t) =−dln(S)/dt.