
Page 232 - 20dynamics of cancer
P. 232
INHERITANCE 217
6 (a) 8 (b) 2 (c)
Incidence 4 2 X 10 -4 4 2 $LLA
1 R
1
0
10 20 40 80 22 32 42 22 32 42
Age
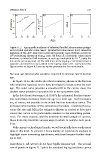
Figure 11.2 Age-specific incidence of inherited familial adenomatous polypo-
sis (FAP) and sporadic colon cancer. (a) Inherited colon cancer (FAP) caused by
mutation of the APC gene (top curve) and sporadic cases (bottom curve) per
6
10 population, shown on a log 10 scale. (b) Ratio, R, of sporadic colon cancer
incidence to inherited FAP incidence at each age multiplied by 10 −4 , using the
data in the previous panel. (c) The difference in the log-log acceleration between
sporadic and inherited cases, which is the log-log slope of R. I presented this
figure earlier as Figure 8.5; see my earlier presentation for more details.
five-year age interval who would be expected to develop cancer by that
age.
In Figure 11.3a, the circles plot their estimates, shown as the fraction
who would be expected not to have developed a breast tumor by each
age. The solid curve provides a smoothed fit to the carrier class; the
dashed curve provides a smoothed fit to the noncarrier class.
In the data from Struewing et al. (1997), the estimated fraction tumor-
less sometimes increases from one age to a later age. Such increases
are, of course, not possible in the actual fraction tumorless curves. The
increases arise because of the estimation procedure. I mention this be-
cause the rise and fall in the estimates (shown as circles) at later ages
causes the curves to be particularly sensitive to the smoothing param-
eters. For these reasons, and the moderately small sample of carriers,
these data only illustrate various ways in which to analyze such prob-
lems.
With current technological trends, we will eventually have vastly more
data of this kind. At present, I focus mainly on exploratory analysis to
highlight some interesting hypotheses, which will require further stud-
ies to test.
Hypothesis 1: All carriers do not have highly elevated risk.—The second
row of panels in Figure 11.3 plots the standard log-log incidence curves