
Page 283 - 16Neonatal Jaundice_compressed
P. 283
Neonatal jaundice
Evidence table – Prediction of hyperbilirubinaemia (effectiveness)
Bibliographic details Study type & Patient characteristics Test, Reference Standard, Results Reviewers Comments
Evidence level Threshold for a positive test
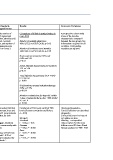
Petersen JR; Study Type: Babies with a diagnosis-related group Comparison of the number of Comparison of bilirubin testing (values in Retrospective cohort study
Retrospective cohort designation indicating ‘normal births, number of vaginal and mean (SD) Some of the baseline
Year: 2005 study newborn’ and admitted in the caesarean deliveries, ethnicity and characteristics compared
newborn unit of a tertiary hospital gender distribution, newborn Number of monthly admissions between the two groups, but
Country: USA Evidence Level: II from August 2002 to December 2003. readmission rates, and number of 404.6 (33.2) vs 420.7 (36.8), p=0.42 information not given for all
(n = 6603, males 52.9%) serum bilirubin measurements variables. Confounding
43 between Group 1 vs Group 2 Number of newborns tested monthly variables not adjusted
Group 1: babies born before TcB 128.0 (26.1) vs 152.1 (26.2), p=0.10
introduced – August 2002 to March
2003 % of newborns tested by TSB levels
(n = 3237, 51.3% males) 6.4% vs 8.7%
p=0.21
Group 2: babies born after TcB
introduced – May 2003 to December Serum bilirubin measurement per newborn
2003 1.51 vs 1.56
(n = 3366, 53.2% males) p=0.33
Exclusion: babies who did not fit the Total bilirubin measurement (TcB +TSB)
criterion of ‘normal newborns’, and 0.37 vs 0.61
those born in the transitional time – p=0.007
April 2003
% of newborns treated with phototherapy
5.9% vs 7.7%
p=0.014
Newborn readmissions for hyperbil. within
7 days of initial discharge (per 1000 births)
4.5 vs 1.8
p=0.044
Ebbesen F; Study Type: All newborns more than 24 hours old TcB measurement using BiliChek Correlation of TcB levels with lab TSB Unselected population
Diagnostic study who for clinical reasons had their from forehead, sternum, knee and levels (Pearson correlation coefficient, Test & Reference test described
Year: 2002 plasma bilirubin determination during the foot – mean of 5 measurements n = 210) adequately
Evidence Level: III the day, except at weekends. from each site taken for data Test and reference test carried
Country: analysis. Group 1: out within one hour
Denmark Group 1: Both preterm infants Forehead Blinding – not specified
< 35 weeks and sick term and near- Reference standard: Laboratory r = 0.88, p > 0.05 Data not given for the mean
45 term infants in the NICU TSB levels taken concurrently with Sternum difference and SD from Bland
TcB measurement r = 0.82, P < 0.001 Altman analysis for TSB - TcB
n = 261 Knee
mean BW 2521 g - range 680 to Diagnostic accuracy of TcB from r = 0.77, P < 0.001
4645 g, mean GA 34.6 weeks - range forehead (threshold ≥ 0.70 of Foot
st
25 to 43 weeks postnatal age at 1 phototherapy limit) estimated for r = 0.51, P < 0.001
TcB: 98.4 - range 48 – 840 predicting TSB levels ≥
214