
Page 118 - 20dynamics of cancer
P. 118
THEORY I 103
n-a 1-
h t r i b 0 1 2 3 4 5 6 5
y o u n g 2 3 4 5 6 3
a g e m e f i l d i 4 5 6 1
d l o 5 6 0
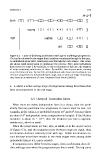
Figure 6.2 Cause of declining acceleration with age in multistage progression.
The top line shows the six stages that a newborn must pass through in this case.
As individuals grow older, many may pass through the early stages. This exam-
ple shows rapid progression to emphasize the process. Here, most individuals
have passed to stage 2 by early life, so the acceleration at this age, the number
of steps remaining minus one, is three. By midlife, two steps remain, causing
an acceleration of one. By late life, all individuals who have not developed can-
cer have progressed to the penultimate stage, and so with one stage remaining,
they have an acceleration of zero. Redrawn from Frank (2004d).
a−1, where a is the average stage of progression among those lines that
have not progressed to the nth stage.
6.4 Unequal Transition Rates
When there are many independent lines in a tissue, then the prob-
ability that any particular line progresses to cancer must be low. For
7
8
example, in the colon, L is probably between 10 and 10 , because there
7
are about 10 independent tissue compartments (crypts). If the lifetime
incidence is about m = 10 −1 , then the incidence per line is approxi-
mately m/L, which is small.
When the progression per line, m/L, is small, as in the upper curves
of Figure 6.1a, and the transition rates between steps are equal, then
acceleration declines relatively little with age. Stable acceleration oc-
curs because most lines remain in the early stages even among older
individuals (Figure 6.3, upper panels).
If transition rates differ between stages, then acceleration does de-
cline with age even when the progression per line is small. The top curve