
Page 117 - 20dynamics of cancer
P. 117
102 CHAPTER 6
Q ! 0 !
%GGIPIVEXMSR
E F
%KI %KI
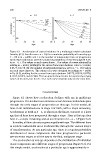
Figure 6.1 Acceleration of cancer incidence in a multistage model calculated
from Eq. (6.3). For all curves: n = 10; the cumulative probability of cancer by age
T = 80 is m = p(80); and L is the number of independent lines of progression
within each individual. (a) The cumulative probability of cancer by age 80 is set
to m = 0.1. The values on each curve show L. The values of u were obtained by
solving m = p(80), yielding for the curves from top to bottom: 0.00757, 0.0209,
0.0373, 0.0778. (b) The number of independent lines is set to L = 1. The values
on each curve show m. The values of u were obtained by solving m = p(80)
in Eq. (6.5), yielding for the curves from top to bottom: 0.0275, 0.0516, 0.0778,
0.1017, 0.1423, and 0.2348. The two panels show results for separately varying
values of m and L, but for m< 0.2, each curve depends only on the ratio m/L.
CONCLUSIONS
Figure 6.1 shows how acceleration declines with age in multistage
progression. The decline in acceleration occurs because individuals pass
through the early stages of progression as they age. In this model, all
lines in all individuals are in stage 0 at birth, with n steps remaining.
Acceleration at birth is n − 1, as shown in the figure. Suppose at a later
age that all lines have progressed through a steps. Then at that age they
have n − a steps remaining, and an acceleration of n − a − 1 (Figure 6.2).
In reality, all lines do not progress equally with age. The different lines
in separate individuals move stochastically through the various stages
of transformation. At any particular age, there is a regular probability
distribution of tissue components that have progressed to particular
precancerous stages or all the way to the final, malignant stage.
The acceleration at any age depends on the distribution of individual
tissue components into different stages of progression (Figure 6.3). For
this simple model, acceleration at a particular age is approximately n −