
Page 246 - untitled
P. 246
THE BUST
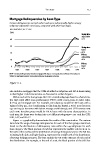
Mortgage Delinquencies by Loan Type
Serious delinquencies started earlier and were substantially higher among
subprime adjustable-rate loans, compared with other loan types.
IN PERCENT, BY TYPE
50%
Subprime
adjustable
40 rate
30
Subprime
rate
20
Prime
adjustable
10 rate
Prime
0
rate
1998 2000 2002 2004 2006 2008 2010
NOTE: Serious delinquencies include mortgages 90 days or more past due and those in foreclosure.
SOURCE: Mortgage Bankers Association National Delinquency Survey
Figure .
also includes mortgages that the GSEs identified as subprime and Alt-A loans owing
to their higher-risk characteristics, as discussed in earlier chapters.
Within each of the four groups, the FCIC created subgroups based on characteris-
tics that could affect loan performance: FICO credit scores, loan-to-value ratios
(LTVs), and mortgage size. For example, one subgroup would be GSE loans with a
balance below , (conforming to GSE loan size limits), a FICO score between
and (a borrower with below-average credit history), and LTV between
and . Another group would be Alt-A loans with the same characteristics. In
each year, the loans were broken into different subgroups— each for GSE,
SUB, ALT, and FHA.
Figure . graphically demonstrates the results of the examination. The various
bars show the range of average delinquencies for each of the four groups examined,
based on the distribution of delinquency rates within the subgroups for each
loan category. The black portion of each bar represents the middle ( on ei-
ther side of the median) of the distribution of average delinquency rates. The full bar,
including both dark and light shading, represents the middle of the distribution
of average delinquency rates. The bars exclude the at the extremes of each end of
the distribution. For example, at the end of , the black portion of the GSE bar