
Page 245 - untitled
P. 245
FINANCIAL CRISIS INQUIRY COMMISSION REPORT
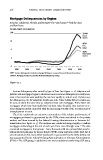
Mortgage Delinquencies by Region
Arizona, California, Florida, and Nevada—the “sand states”—had the most
problem loans.
IN PERCENT, BY REGION
16%
13.6%
Sand
states
12
8.7%
U.S.
total
8
7.0%
Non-sand
states
4
0
1998 2000 2002 2004 2006 2008 2010
NOTE: Serious delinquencies include mortgages 90 days or more past due and those in foreclosure.
SOURCE: Mortgage Bankers Association National Delinquency Survey
Figure .
Serious delinquency also varied by type of loan (see figure .). Subprime ad-
justable-rate mortgages began to show increases in serious delinquency in early ,
even as house prices were peaking; the rate rose rapidly to in . By late ,
the delinquency rate for subprime ARMs was . Prime ARMs did not weaken un-
til , at about the same time as subprime fixed-rate mortgages. Prime fixed-rate
mortgages, which have historically been the least risky, showed a slow increase in se-
rious delinquency that coincided with the increasing severity of the recession and of
unemployment in .
The FCIC undertook an extensive examination of the relative performance of
mortgages purchased or guaranteed by the GSEs, those securitized in the private
market, and those insured by the Federal Housing Administration or Veterans Ad-
ministration (see figure .). The analysis was conducted using roughly million
mortgages outstanding at the end of each year from through . The data
contained mortgages in four groups—loans that were sold into private label securiti-
zations labeled subprime by issuers (labeled SUB), loans sold into private label Alt-A
securitizations (ALT), loans either purchased or guaranteed by the GSEs (GSE), and
loans guaranteed by the Federal Housing Administration or Veterans Administration
(FHA). The GSE group, in addition to the more traditional conforming GSE loans,
