Page 332 - 20dynamics of cancer
P. 332

APPENDIX: INCIDENCE                                         317

                                     'SPSVIGX        &PEHHIV        3VEP TLV        4ERGVIEW
                               7))6   z


                               7))6   z


                                  )RKPERH


                                  7[IHIR


                               .ETER


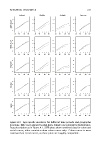
                              Figure A.3  Age-specific incidence for different time periods and geographic
                              locations. Male cases shown by solid lines; female cases shown by dashed lines.
                              Data description as in Figure A.1. SEER plots show combined data for colon and
                              rectal cancer, other countries show colon cancer only. Colon cancer is more
                              common than rectal cancer, so these plots are roughly comparable.
   327   328   329   330   331   332   333   334   335   336   337