
Page 331 - 20dynamics of cancer
P. 331
316 APPENDIX: INCIDENCE
%PP &VIEWX 4VSWXEXI 0YRK
7))6 z
z z
z
7))6 z
z z
z
)RKPERH
z
z z
7[IHIR
z
z z
.ETER
z
z z
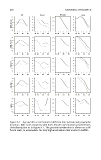
Figure A.2 Age-specific acceleration for different time periods and geographic
locations. Male cases shown by solid lines; female cases shown by dashed lines.
Data description as in Figure A.1. The prostate acceleration is shown on a dif-
ferent scale, to accomodate the very high acceleration that occurs in midlife.