
Page 330 - 20dynamics of cancer
P. 330
APPENDIX: INCIDENCE 315
%PP &VIEWX 4VSWXEXI 0YRK
7))6 z
7))6 z
)RKPERH
7[IHIR
.ETER
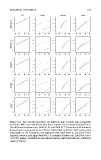
Figure A.1 Age-specific incidence for different time periods and geographic
locations. Male cases shown by solid lines; female cases shown by dashed lines.
The different databases are: SEER 93–97 and SEER 73–77 from the SEER database
(http://seer.cancer.gov/) in the USA for 1993–1997 and 1973–1977 using white
individuals in the standard nine registries that have been in use since 1973;
England, Sweden, and Japan from the CI5 database (Parkin et al. 2002) for 1993–
1997 (for Japan, I excluded the Hiroshima registry, which had data for a different
range of dates).