
Page 293 - 20dynamics of cancer
P. 293
278 CHAPTER 13
u = 10 −6
1
(a)
1st quartile
0.8 4th quartile
all
0.6
Proportion attributable to developmental mutations
0.4
0.2
0
0 10 20 30 40 50 60 70 80 90 100
−5
u = 10
1
(b)
0.8
0.6
0.4
0.2
0
0 10 20 30 40 50 60 70 80 90 100
−4
u = 10
1
(c)
0.8
0.6
0.4
0.2
0 10 20 30 40 50 60 70 80 90 100
Age
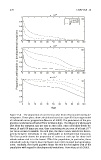
Figure 13.4 The proportion of cancers that arise from cells mutated during de-
velopment. These plots show calculations based on a specific four-stage model
of colorectal cancer progression (Meza et al. 2005). The parameters of the pro-
gression model were estimated from incidence data. The values of u above each
plot show the mutation rate per year in stem cells. Stem cells likely divide be-
tween 10 and 100 times per year, thus a mutation rate per year of at least 10 −5
per locus seems reasonable. In each plot, the three curves sketch the hetero-
geneity between individuals in risk attributable to developmental mutations.
The first quartile shows the proportion of cancers at each age for those indi-
viduals whose risk is in the lowest 25% of the population, in particular, those
individuals who by chance have the fewest stem cells mutated during develop-
ment. Similarly, the fourth quartile shows the risk for the highest 25% of the
population with regard to developmental mutations. From Meza et al. (2005).