
Page 291 - 20dynamics of cancer
P. 291
276 CHAPTER 13
N = 10 7 N = 10 8
3 10 -7 -7
Log 10 [p/(1-p)] 1 10 -6 10 -5 10 10 -6 10 -5
2
0
–1
–2
0 1 2 3 4 0 1 2 3 4
Log (number initially mutated stem cells)
10
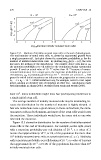
Figure 13.3 Number of initially mutated stem cells at the end of development.
The total number of initial stem cells, N, derive by exponential growth from
a single precursor cell. Each plot shows the cumulative probability, p, for the
number of mutated initial stem cells. By plotting log 10 [p/(1 − p)], the zero
line gives the median of the distribution. The number above each line is u e ,
the mutation probability per cell added to the population during exponential
growth. (I used an actual value of 10 −5.2 rather than 10 −5 because of compu-
tational limitations.) For a single gene, the mutation probability per gene per
cell division, u g , is probably greater than 10 −7 . If there are at least L = 100
genes for which initial mutations can influence the progression to cancer, then
u e = L × u g ≥ 10 −5 . Initial mutations may, for example, occur in DNA repair
genes, causing an elevated rate of mutation at other loci. Calculations made
with algorithms in Zheng (2005). Modified from Frank and Nowak (2003).
5
least 10 . Some individuals might have two predisposing mutations in
a single initial stem cell.
The average number of initially mutated cells may be misleading, be-
cause the distribution for the number of mutants is highly skewed. A
few rare individuals have a great excess; in those individuals, the muta-
tion arises early in development, and most of the stem cells would carry
the mutation. Those individuals would have the same risk as one who
inherited the mutation.
Figure 13.3 shows the distribution for the number of initially mutated
stem cells at the end of development. For example, in the right panel,
with a mutation probability per cell division of 10 −6 ,a y value of 2
means that approximately 10 −2 , or 1%, of the population has more than
4
10 initially mutated stem cells at a particular locus (L = 1). Similarly,
with a mutation probability per cell division of 10 −5 ,a y value of 3 means
that approximately 10 −3 , or 0.1%, of the population has more than 10 4
initially mutated stem cells.