
Page 295 - 16Neonatal Jaundice_compressed
P. 295
Neonatal jaundice
What is the best method of recognising hyperbilirubinaemia?
Evidence table – Recognition
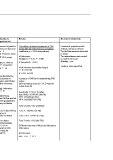
Bibliographic details Study type & Patient characteristics Test, Reference Standard, Results Reviewers Comments
Evidence level Threshold for a positive test
Riskin A; Study Type: Healthy full term and late preterm babies Test: Visual assessment of jaundice Correlation of visual assessment of TSB Unselected population with
Diagnostic study (≥ 35 weeks) examined for clinical (BiliEye) by experienced observers levels with lab TSB (Pearson correlation defined exclusion criterion
Year: 2008 jaundice before discharge (days 2 to 5 of (total 23 observers – 5 coefficient, n = 3532 observations) Test & Reference test described
Evidence Level: life) in a hospital neonatologists and 17 nurses, mean in detail
Country: Ib experience 11.4 ± 10.2 years). All observers Test and reference test carried
Israel n = 1129, Weighted r = 0.75, P < 0.001 out within one hour
total observations = 3532, Blinding – yes
61 No. of observations per observer κ (weighted) = 0.363
mean BW 3298 ± 462 g, were record in 1195 encounters Each observer separately (range) Funding: None specified
mean GA 39.5 ± 1.4 weeks, with a mean of 3.0 ± 1.8 r = 0.51 to 0.88
mean time of assessment 62 ± 24 hours observers.
(median 55 hours; range 9 to 252 hours) The observers were identified by κ = 0.11 to 0.52
Gender: Males = 52.3%
code numbers and unaware of Accuracy of BiliEye for determining TSB
Ethnicity laboratory TSB values and BiliEye values
Majority reported as Ashkenazi or values made by other observers. (after grouping Zones B, C & D together
versus Zone A)
Sephardic Jews (73%) or Arabs (26%) Reference standard: Laboratory
Exclusion: babies with < 50 TSB levels within 1 hr Sensitivity: 337/567 (59.4%)
observations, visual assessment done Analysis: After determining Specificity: 2627/2965 (88.6%)
after starting phototherapy correlation between BiliEye and lab PPV: 337/675 (49.9%)
TSB, the values were grouped into NPV: 2627/2857 (91.9%)
risk zones according to Bhutani
nomogram. False negative rate of BiliEye
Accuracy of BiliEye in determining Zone A: 230/2857 (8.1%)
TSB levels (or degree of
hyperbilirubinaemia) evaluated. Zone C + D: 67/109 (61.5%)
Ability of BiliEye to detect Zone D only: 13/15 (86.7%)
significant hyperbilirubinaemia
(defined as zones C+D on Difference between BiliEye and laboratory
nomogram) analysed by ROC TSB values
curve – after correcting for
postpartum age and GA All observers
MD = 0.11 ± 2.17
220