
Page 427 - An Evidence Review of Active Surveillance in Men With Localized Prostate Cancer
P. 427
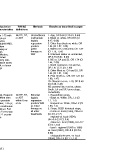
Appendix Table C3.2. KQ3 multivariable analyses (continued)
 Author   Factors   Data source   Duration   Analyzed   Population   WW/AS   Methods   Results as described in paper
 yr   sample   characteristics  definitions
 PMI
 Roberts 180    Clinical,   SEER-  2004-  8323   Men ≥75 with   No RP, RT,   Unconditional  1. Age, OR 0.92 (CI 0.91, 0.94)
  2011   geographic   Medicare   2005   localized   or ADT   multivariate   2. Black vs. white, OR 0.57 (CI
 21396507   disease,            logistic         0.47, 0.68)
 excluded HMO,                  regression       3. Other than black vs. white, OR
 dx from                        predicts         1.34 (CI 1.07, 1.66)
 autopsy or                     active           4. Married vs. unmarried, OR 1.37
 death                          therapy vs.      (CI 1.19, 1.58)
 certificates,                  WW               5. Unknown status vs. unmarried,
 unknown                                         OR 0.73 (0.61, 0.89)
 poverty rate,                                   6. NE vs. CA and SJ, OR 1.74 (CI
 Gleason score,                                  1.44, 2.09)
 PSA, or tumor                                   7. North Central vs. CA and SJ,
 stage                                           OR 1.61 (CI 1.30, 1.99)
                                                 8. Other West vs. CA and SJ, OR
                                                 1.24 (CI 1.01, 1.53)
                                                 9. PSA 10-20 vs. >20, OR 1.21 (CI
                                                 1.00, 1.47)
                                                 10. Gleason 5-6 vs. 7-10, OR 0.40
                                                 (CI 0.36, 0.45)
                                                 NS: poverty line, rural vs. urban,
                                                 South, LA and SF, tumor stage,
                                                 comorbidity
 Shavers 166     Clinical,   SEER-  1994-  24,974   Black, Hispanic   No RP, RT,   Binomial   1. Race/ethnic group,
 2004   social,   Medicare   1996   or White men   or ADT   logistic     - Black vs. White, OR=1.3 (CI
 15009794   delivery   with prostate   within 6 mo   regression   1.1, 1.4)
 system   cancer, ≥65 yr,  of dx   predicts WW     - Hispanic vs. White, OR=1.2 (CI
 with continuous                as initial       1.03, 1.4)
 Medicare Part                  therapy vs.      2. Stage, SEER historical stage,
 A & B coverage                 all other          - in situ vs. local (1994), OR=8.8
 for ≥1 yr prior                treatments       (CI 3.5, 21.7)
 to dx                                             - regional vs. local (1994),
                                                 OR=0.4 (CI 0.3, 0.4)
                                                   - distant vs. local (1994), OR=0.2
                                                 (CI 0.1, 0.2)
                                                   - local + regional (1995 to 1996)
                                                 vs. local (1994), OR=0.9 (CI 0.8,
                                                 0.98)
                                                   - unstaged/unknown, vs. local
                                                 (1994), OR=1.2 (CI 1.1, 1.3)


 C-131