
Page 165 - 16Neonatal Jaundice_compressed
P. 165
Neonatal jaundice
Review findings
Dichotomous outcomes
None of the studies reported on either the number of exchange transfusions needed or the
adverse effect profile of clofibrate.
Continuous outcomes
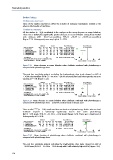
All five studies (n = 310) contributed to the analysis on the mean decrease in serum bilirubin.
There was a statistically significantly greater decrease in serum bilirubin among those treated
with clofibrate (MD = −63.62 micromol/litre, 95% CI −68.59 to −58.66 micromol/litre)
(Figure 7.22). Heterogeneity was very high at I² = 95%.
Clofibrate Control Mean Difference Mean Difference
Study or Subgroup Mean SD Total Mean SD Total Weight IV, Fixed, 95% CI IV, Fixed, 95% CI
F - Ashkan 2007 -186 14 60 -104 15 30 59.5% -82.00 [-88.43, -75.57]
F - Eghbalian 2007 -171 30 30 -137 45 30 6.6% -34.00 [-53.35, -14.65]
F - Mohammadzadeh 2005 -210 37 30 -184 44 30 5.8% -26.00 [-46.57, -5.43]
F - Zahedpasha 2007 -148 20 30 -108 24 30 19.7% -40.00 [-51.18, -28.82]
F - Zahedpasha 2008 -142 26 21 -104 29 19 8.4% -38.00 [-55.14, -20.86]
Total (95% CI) 171 139 100.0% -63.62 [-68.59, -58.66]
Heterogeneity: Chi² = 78.96, df = 4 (P < 0.00001); I² = 95% -100 -50 0 50 100
Test for overall effect: Z = 25.13 (P < 0.00001) Favours Clofibrate Favours Control
Figure 7.22 Mean decrease in serum bilirubin when clofibrate combined with phototherapy is
compared with phototherapy alone
The post hoc sensitivity analysis excluding the low/moderate dose study showed an MD of
−36.60 micromol/litre (95% CI −44.40 to −28.80 micromol/litre) and heterogeneity was non-
existent at I² = 0% (Figure 7.23).
Clofibrate Control Mean Difference Mean Difference
Study or Subgroup Mean SD Total Mean SD Total Weight IV, Fixed, 95% CI IV, Fixed, 95% CI
F - Eghbalian 2007 -171 30 30 -137 45 30 16.2% -34.00 [-53.35, -14.65]
F - Mohammadzadeh 2005 -210 37 30 -184 44 30 14.4% -26.00 [-46.57, -5.43]
F - Zahedpasha 2007 -148 20 30 -108 24 30 48.7% -40.00 [-51.18, -28.82]
F - Zahedpasha 2008 -142 26 21 -104 29 19 20.7% -38.00 [-55.14, -20.86]
Total (95% CI) 111 109 100.0% -36.60 [-44.40, -28.80]
Heterogeneity: Chi² = 1.47, df = 3 (P = 0.69); I² = 0%
-50
50
Test for overall effect: Z = 9.20 (P < 0.00001) -100 Favours Clofibrate 0 Favours Control 100
Figure 7.23 Mean decrease in serum bilirubin when clofibrate combined with phototherapy is
compared with phototherapy alone – sensitivity analysis based on dosage used
Three studies 212-214 (n = 210) contributed data on duration of phototherapy. Babies who received
clofibrate required a statistically significantly shorter time under phototherapy
(MD = −9.58 hours, 95% CI −11.14 to −8.02 hours) (Figure 7.24). There was a high level of
heterogeneity at I² = 86%.
Clofibrate Control Mean Difference Mean Difference
Study or Subgroup Mean SD Total Mean SD Total Weight IV, Fixed, 95% CI IV, Fixed, 95% CI
F - Ashkan 2007 14.45 1.4 60 23.3 4.4 30 93.6% -8.85 [-10.46, -7.24]
F - Eghbalian 2007 53.6 15 30 68.8 21.6 30 2.8% -15.20 [-24.61, -5.79]
F - Mohammadzadeh 2005 30 12.9 30 54 18.8 30 3.7% -24.00 [-32.16, -15.84]
Total (95% CI) 120 90 100.0% -9.58 [-11.14, -8.02]
Heterogeneity: Chi² = 14.16, df = 2 (P = 0.0008); I² = 86% -100 -50 0 50 100
Test for overall effect: Z = 12.03 (P < 0.00001) Favours Clofibrate Favours Control
Figure 7.24 Mean duration of phototherapy when clofibrate combined with phototherapy is
compared with phototherapy alone
The post hoc sensitivity analysis excluding the low/moderate dose study showed an MD of
−20.22 hours (95% CI −26.39 to −14.06 hours) with I² still relatively high at 48% (Figure 7.25).
134