
Page 76 - 15Diarrhoeaandvomiting
P. 76
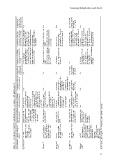
Assessing dehydration and shock


                    Proportion of   children with   elevated glucose  N/A  N/A  N/A  13/119 (10.9%)  (hyperglycaemia   defined as   >140 mg/dl)  N/A


                    Proportion of children  with serum bicarbonate   concentration < normal  73/101 (72%) dehydrated  children and 576/1047  (55%) children without  without dehydration had a  dehydration had a low  bicarbonate concentration  (low bicarbonate  concentration defined as   <21 mmol/l)  Proportion of children not   stated 4% of children had a low  bicarbonate concentration  (≤16 mmol/l)  13/76 (17.1%)  (serum bicarbonate  concentration <15 mmol/l)  (lowest val


                    Proportion of children  with urea concentration   > normal  10/101 (30%) of  dehydrated children and  56/1047 (5%) children   raised urea concentration (raised urea concentration   defined as >7 mmol/l)  Proportion of children not   stated 8% of children had raised  serum urea concentration   (>6 mmol/l)  17/76 (22%) (serum urea concentration   >6 mmol/l)  N/A  3/16 (19%)  hypoglycaemic children   had raised BUN  44/150 (29%) non- hypoglycaemic childre


                    Proportion of   children with   hypokalaemia  N/A  N/A  N/A  5/119 (4.2%)  (hypokalaemia   defined as   <3 mmol/l)  N/A


                    Proportion of children   with hyponatraemia  N/A  N/A  17/76 (22%)  (serum sodium   concentration within   the range 128–  134 mmol/l)  No definition of   hyponatraemia given  4/119 (3.4%)  (hyponatraemia   defined as  1/119 (0.84%) had raised  <130 mmol/l)  N/A


                 Incidence of biochemical disturbances in children with gastroenteritis


                    Proportion of children Proportion of children   with hypernatraemia with dehydration  8/1119 (0.71%) In total, 101/1148  (9%) were dehydrated,  (hypernatraemia defined   of which: as plasma sodium  •  89/1148 (8%) were  concentration of   <5% dehydrated ≥150 mmol/l) •  11/1148 (1%) were  11/101 (11%) dehydrated  5–10% dehydrated children and 6/1047  •  1/1148 was >10%  (0.57%) children without   dehydrated dehydration had plasma  sodium concentration o


                    Study reference Number and age of   children   n = 1148  Age range 0–10 years   (37% were   < 6 months and 82%   were < 2 years)  n = 447 admissions   (21 re-admissions)   made by 426 children   younger than 2 years   (75% were < 1 year)  n = 215  Age range 2 weeks   to 9 years (61% were   < 1 year)  n = 119 Age range 2 months to  moderate dehydration  15 years  n = 528  Data presented for  196/207 children with  with dehydration  acute gastroenteritis


                 Table 4.7   Conway et al. 53  Ellis et al. 57  Jenkins and   Ansari 58  Yurdakok and   Oran 79  Reid and   Losek 80


                                                                                                          51