
Page 111 - Screening for Cervical Cancer: Systematic Evidence Review
P. 111
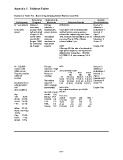
Appendix C.  Evidence Tables


               Evidence Table 1A.  Screening Among Older Women (cont'd)

                                 Screening     Outcomes &                                         Quality
                 Participants     Program       Measures             Relevant Results         Considerations
               N = not defined  National     Primary        INTERVAL:                         Denom=2
                               screening     outcome =                                        Attrition=1
               (only rates     program with   histologically   Cumulative rate of histologically   Indications=1
               given)          call and recall  proven lesions  verified lesions among women   Interval=2
                               of ages 25-69                referred for colposcopy rises from   Age=2
                               (1970-1987)   Secondary      10% of those referred within 2 yrs of  Relevance=1
                               now 20-69     outcome =      a normal Pap to 70% of those      Standard=2
                               (began 1988)  moderate to    referred within 5 yrs.            Score=11
                               for screening   high grade
                               q2-3 years    smears         AGE:                              Grade=Fair
                                                            After age 60, the rate of moderate to
                                                            high-grade dysplasia among women
                                                            without prior screening = 16/1000;
                                                            5.7/1000 if 1-4 prior screens; 2.8 if
                                                            ≥ 5


               N = 128,805                   Primary        AGE:                              Denom=2
               women with                    outcome = high                                   Attrition=2
               initial normal                grade SIL or   2nd screening results             Indications=1
               Pap and another               worse on                         LSIL           HSIL        SCCA   Interval=2
               within 36                     cytology                          (%)              (%)            (%)   Age=2
               months                                       < 30       389 (3.2)      80 (0.7)    1 (0.01)   Relevance=2
                                                            30-49     523 (1.0)    111 (0.2)    5 (0.01)
                                             Secondary      50-64     186 (0.4)    67 (0.14)    4 (0.01)   Standard=0
               (excludes those               outcome =      ≥ 65       42 (0.3)    13 (0.08)    3 (0.02)   Score=11
               with glandular                other cytologic
               cell                          abnormality    INTERVAL:                         Grade=Fair
               abnormalities)                               Age-adjusted incidence per 10,000
                                             Second smears  women
               Age                           results:     (%)
               <30         9.5%              Benign   94.4   Time from
                                                            normal         ASCUS      LSIL         HSIL +
               30-49    41.6%                ASCUS    3.4   9-12 mos       377          107               25
               50-64    36.8%                LSIL         0.9   13-24             373          125               29
               ≥ 65      12.1%               HSIL        0.2   25-36             415          141               33
                                             Cancer     0.0   P (trend)       0.36         0.01            0.42
               White    57.2%
               Black, non-Hisp
               13.4%
               Hisp      17.6%
               Asian      2.4%
               AmInd    8.5%


                                                            C-17