
Page 533 - untitled
P. 533
504 Dissenting Statement
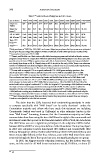
Table 7. GSE Purchases of Subprime and Alt-A loans
105
$ in billions 1997 1998 1999 2000 2001 2002 2003 2004 2005 2006 2007 1997-2007
Subprime $3* $18* $18* $11* $16* $38 $82 $180 $169 $110 $62 $707
PMBS
Subprime $37 $83 $74 $65 $159 $206 $262 $144 $139 $138 $195 $1,502
loans**
Alt-A PMBS Unk. Unk, Unk. Unk. Unk. $18 $12 $30 $36 $43 $15 $154
Alt-A loans*** Unk. Unk, Unk. Unk. Unk. $66 $77 $64 $77 $157 $178 $619
High LTV $32 $44 $62 $61 $84 $87 $159 $123 $126 $120 $226 $1,124
loans****
Total***** $72 $145 $154 $137 $259 $415 $592 $541 $547 $568 $676 $4,106
*Total purchases of PMBS for 1997-2001 are known. Subprime purchases for these years were estimated
based upon the percentage that subprime PMBS constituted of total PMBS purchases in 2002 (57%).
**Loans where borrower’s FICO <660.
*** Fannie and Freddie used their various aff ordable housing programs and individual lender variance
programs (many times in conjunction with their automated underwriting systems once these came into
general use in the late-1990s) to approve loans with Alt-A characteristics. However, they generally did
not classify these loans as Alt-A. Classifi cation as Alt-A started in the early-1990s. Th ere is an unknown
number of additional loans that had higher debt ratios, reduced reserves, loosened credit requirements,
expanded seller contributions, etc. Th e volume of these loans is not included.
****Loans with an original LTV or original combined LTV >90% (given industry practices, this
eff ectively means >=95%). Data to estimate loans with CLTV.>90% is unavailable prior to 2003.
Amounts for 2003-2007 are grossed up by 60% to account for the impact of loans with a CLTV >90%.
Th ese estimates are based on disclosures by Fannie and Freddie that at the end of 2007 their total
exposures to loans with an LTV or CLTV >90% was 50% and 75% percent respectively higher than
their exposure to loans with an LTV >90%. Fannie reports on p. 128 of its 2007 10-K that 15% of its
entire book had an original combined LTV >90%. Its Original LTV percentage >90% (without counting
the impact of any 2nd mortgage simultaneously negotiated) is 9.9%. Freddie reports on p60 of its
Q2:2008 10 Q that 14% of its portfolio had an original combined LTV >90%. Its OLTV percentage
>90% (without counting any simultaneous 2nd) is 8%. While Fannie and Freddie purchased only the
fi rst mortgage, these loans had the same or higher incidence of default as a loan with an LTV of >90%.
*****Since loans may have more than one characteristic, they may appear in more than one category.
Totals are not adjusted to take this into account.
Th e claim that the GSEs loosened their underwriting standards in order
to compete specifi cally with “Wall Street” can be easily dismissed—unless the
Commission majority and others who have made this statement are including
Countrywide (which was based in California) or other subprime lenders in the
term “Wall Street.” Assuming, however, that the Commission majority and other
commentators have been using the term Wall Street to apply to the commercial and
investment banks that operate in the fi nancial markets of New York, the data shows
that Wall Street was not a signifi cant participant in the subprime PMBS market
between 2004 and 2007 or at any time before or aft er those dates. Th e top fi ve players
in 2004 were subprime lenders Ameriquest ($55 billion) and Countrywide ($40
billion), followed by Lehman Brothers ($27 billion), GMAC RFC ($26 billion), and
New Century ($22 billion). Other than Lehman, some other Wall Street fi rms were
scattered through the list of the top 25, but were not signifi cant players as a group.
In 2005, the biggest year for subprime issuances, the fi ve leaders were the
same, and the total for all Wall Street institutions was $137 billion, or about 27
105 Id.