
Page 342 - 20dynamics of cancer
P. 342
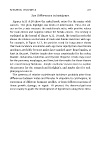
APPENDIX: INCIDENCE                                         327

                                               Sex Differences in Incidence

                                Figures A.13–A.18 show the male:female ratios for the major adult
                              cancers. The plots highlight two kinds of information. First, the val-
                              ues on the y axis measure the male:female ratio, with positive values
                              for male excess and negative values for female excess. The scaling is
                              explained in the legend of Figure A.13. Second, the trend in each plot
                              shows the relative acceleration of male and female incidence with age.
                              For example, in Figure A.13, the positive trend for lung cancer shows
                              that male incidence accelerates with age more rapidly than does female
                              incidence, probably because males have smoked more than females, at
                              least in the past. Positive trends also occur consistently for the colon,
                              bladder, melanoma, leukemia, and thyroid. Negative trends may occur
                              for the pancreas, esophagus, and liver, but the results for those tissues
                              are mixed among locations. Simple nonlinear curves seem to explain
                              the patterns for the stomach and Hodgkin’s, and maybe also for oral-
                              pharyngeal cancers.
                                The patterns of relative male:female incidence probably arise from
                              differences between males and females in exposure to carcinogens, to
                              expression of different hormone profiles, or from different patterns of
                              tissue growth, damage, or repair. At present, the observed patterns
                              serve mainly to guide the development of hypotheses along these lines.